Hey there!
I want to build a little framework to model calculation flows.

The image I appended shows an example of a renuve and costs calculation, which finally calculates some profit.
Structurally this is a directed (acyclic) graph and I am trying to model it somehow via DirectedWiringDiagrams. At the end I want to have a structure where I can enter values for the “leaf” arrows, connect them with function rectangles, connect them further to some final arrows and so on. Here it ends in only one final arrow which is Profit. Then I also want to be able to substitute one leaf arrow with another graph. As you can see in the image example, Personnelcost is a leaf arrow in DyrectedGraph1, and gets substituted by the output arrow Personnelcost in DyrectedGraph2. The final graph then again is a dyrected graph with two new leafs Salary and HoursOfWork, together with the other already existing ones PricePerItem, Items, Materialcost and Operatingcost.
So all in all this looks a lot like DirectedWiringDiagrams, connecting Boxes via Wires on their Ports etc. In this little Code example I tried a little first structure, which shows the final calculation in DyrectedGraph1, Revenue - Costs = Profit:
using Catlab.WiringDiagrams
using Catlab.Graphics
import Catlab.Graphics: Graphviz

show_diagram(d::WiringDiagram) = to_graphviz(d,
  orientation=LeftToRight,
  labels=true, label_attr=:xlabel,
  node_attrs=Graphviz.Attributes(
    :fontname => "Courier",
  ),
  edge_attrs=Graphviz.Attributes(
    :fontname => "Courier",
  )
)

d = WiringDiagram([:Costs, :Revenue], [:Profit])
b = add_box!(d, Box(:calc_profit, [:Costs, :Revenue], [:Profit]))
add_wires!(d, [
    (input_id(d), 1) => (b,1),
    (input_id(d), 2) => (b,2),
    (b, 1) => (output_id(d),1),
])

show_diagram(d)
Output (in case you do not have Graphviz installed):
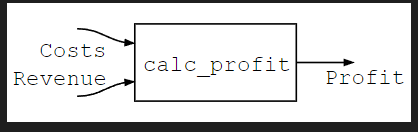
Now what is missing here is to enter an explicit function for :calc_profit, namely (x,y) → x-y. And I also want to be able to use this structure and enter values for the leaf arrows, here Revenue and Costs, and actually calculate or evaluate my graph, getting me the result, here Profit. For example I enter 2000€ for Revenue and 800€ for Costs into my WiringDiagram, and after evaluation I can read out the Profit, 1200€.
Does anyone have experience with DirectedDiagrams, Catlab etc? That would be very awesome if you can help me and maybe sit together with me to talk about it. I hope I could make my purpose clear here.
Thanks much for any help and advice,
Regards, Tillmann