I have two dataseries where each of them also has associated uncertainty. I’m plotting the uncertainty as a translucent envelope around the main line plot of the series.
When using GLMakie/WGLMakie to interact with the figure, selecting a label in the legend turns that series on or off, but not the envelope around it. For example, the default view is

and if I want to only view the
y2 series, I can click on y1 to toggle it/turn it off.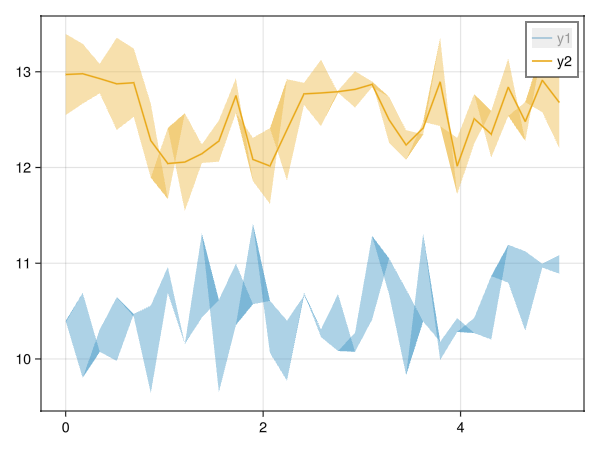
But this still keeps the band around the line. How do I tell Makie that the line plot and the band are paired, and if I toggle one from the legend, both should be turned on/off?
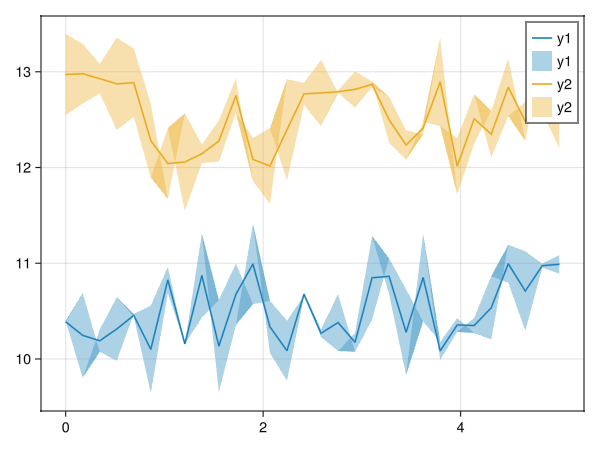
I can also pass in label = "..." to band, but that just creates a new label and the pairing objective is still not fulfilled.

Minimal working example:
using WGLMakie

n = 30
x = range(0, 5, length=n)

y1 = 10 .+ rand(n)
y2 = 12 .+ rand(n)
y1_σ = abs.(rand(n) .- 0.5)
y2_σ = abs.(rand(n) .- 0.6)

let
    fig = Figure()
    ax = Axis(fig[1,1])

    lines!(ax, x, y1, label = "y1")
    band!(ax, x, y1-y1_σ, y1+y1_σ, alpha = 0.4)

    lines!(ax, x, y2, label = "y2")
    band!(ax, x, y2-y2_σ, y2+y2_σ, alpha = 0.4)

    axislegend(ax)

    fig
end
(Created in a Pluto.jl notebook)
Edit: Forgot to put abs() for the uncertainties, that’s why there’s some darker shaded regions in the plot