I’m a new user of JULIA. I’m trying to line by line translation of the following MATLAB code
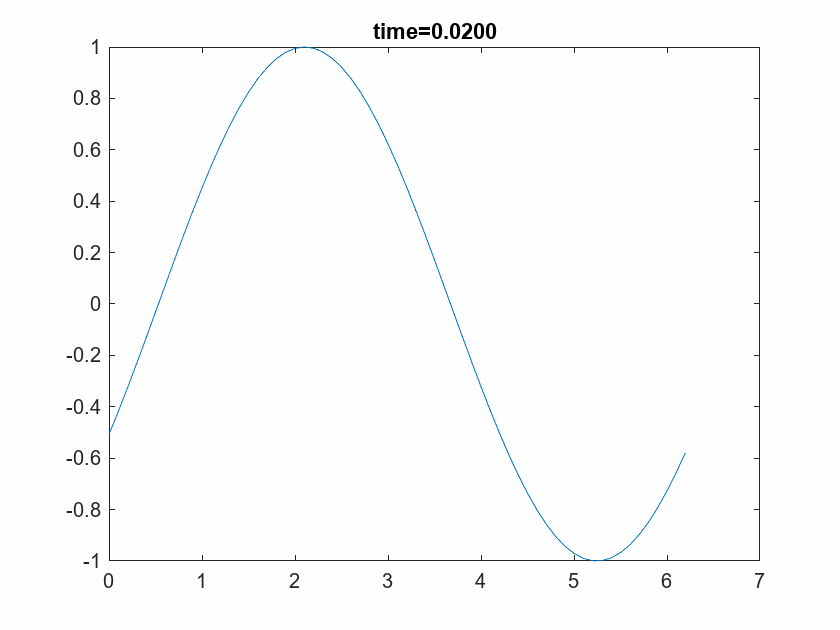
t=0;
dt =1e-4;
tmax=0.5;
nmax=round(tmax/dt);

for n=1:nmax
    t=t+dt;
if mod(n,100)==0
    x = 0:0.1:2*pi;
    y = sin(x + (n/2));
   plot(x, y)
       title(sprintf('time=%1.4f',t))
    pause(0.1)
end
end
which gives the following output
My attempt for JULIA code is as follow:
using Plots
t=0
dt =1e-4;
tmax=0.5;
nmax=round(tmax/dt);
p=plot()
for n=1:nmax
    t=t+dt
if mod(n,100)==0
    x = 0:0.1:2π
    y = sin.(x .+ (n/2))
   plot!(x, y, xlims=(0,2π), ylims=(-1,1),legend=false,fmt=png)
   title!("Time = $t")
    sleep(0.1)
end
end
p
which gives
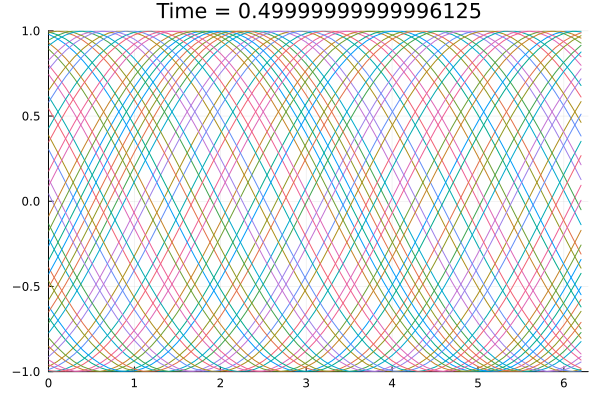
I want to have a gif file like MATLAB with same code.
Your help is appreciated
ENV["GKS_WSTYPE"] = "mp4"

using GR

function main()
    t = 0
    dt = 1e-4
    tmax = 0.5
    nmax = round(tmax / dt)
    for n = 1:nmax
        t = t + dt
        if mod(n, 100) == 0
            x = 0:0.1:2π
            y = sin.(x .+ (n / 2))
            plot(x, y, xlim=(0,2π), ylim=(-1,1), title="Time = $t", grid=false)
        end
    end
end

main()
The above in Julia REFL giving
not a movie.
Also in Jupyter notebook its not giving any output.
Did you set the environment before importing GR?
ENV["GKS_WSTYPE"] = "mp4"
What you probably want to do is this:
using Plots
t=0
dt =1e-4;
tmax=0.5;
nmax=round(tmax/dt);
anim = Animation()
for n=1:nmax
    t=t+dt
    if mod(n,100)==0
        x = 0:0.1:2π
        y = sin.(x .+ (n/2))
        plot(x, y, xlims=(0,2π), ylims=(-1,1),legend=false,title="Time = $t")
        frame(anim)
    end
end
gif(anim, "lol.gif", fps=10)
In short, you need to create a special Animation object and load the frames into it. Refer to this manual for more info.
I hope my answer will be helpful.
Plots is a great package. Some, myself included, prefer Makie. It is a litt more involded to get started with, but offers a lot of flexibility.
The documentation for creating videos in make can be found [here](Animations · Makie, where I have linked to the section that uses Observables to animate a wave with changing time. It should be simple to change the code so that it is the frequency that changes.
Note also that often, creating the video file can take a long time. If I only want to see an animation, and do not need to share the file, I generally love to change the value of an observable in a loop, and just watch the figure as it changes. If you want to do this, use the GLMakie backend, and run Makie.inline(false) to ensure that you get a standalone plotting window. The plot pane is VSCode does not update when Observables change unless you use WGLMakie, which I generally find to be less responsive and slower than GLMake.
