It’s not clear to me what you want to plot, but consider the following:
Π = (e,w) -> sqrt(e) + 4w
Some possibilities (assuming you have issued the command using Plots…):
plot(1:10,1:10,Π,st=:surface)
gives:

[here,
st is short for seriestype], while
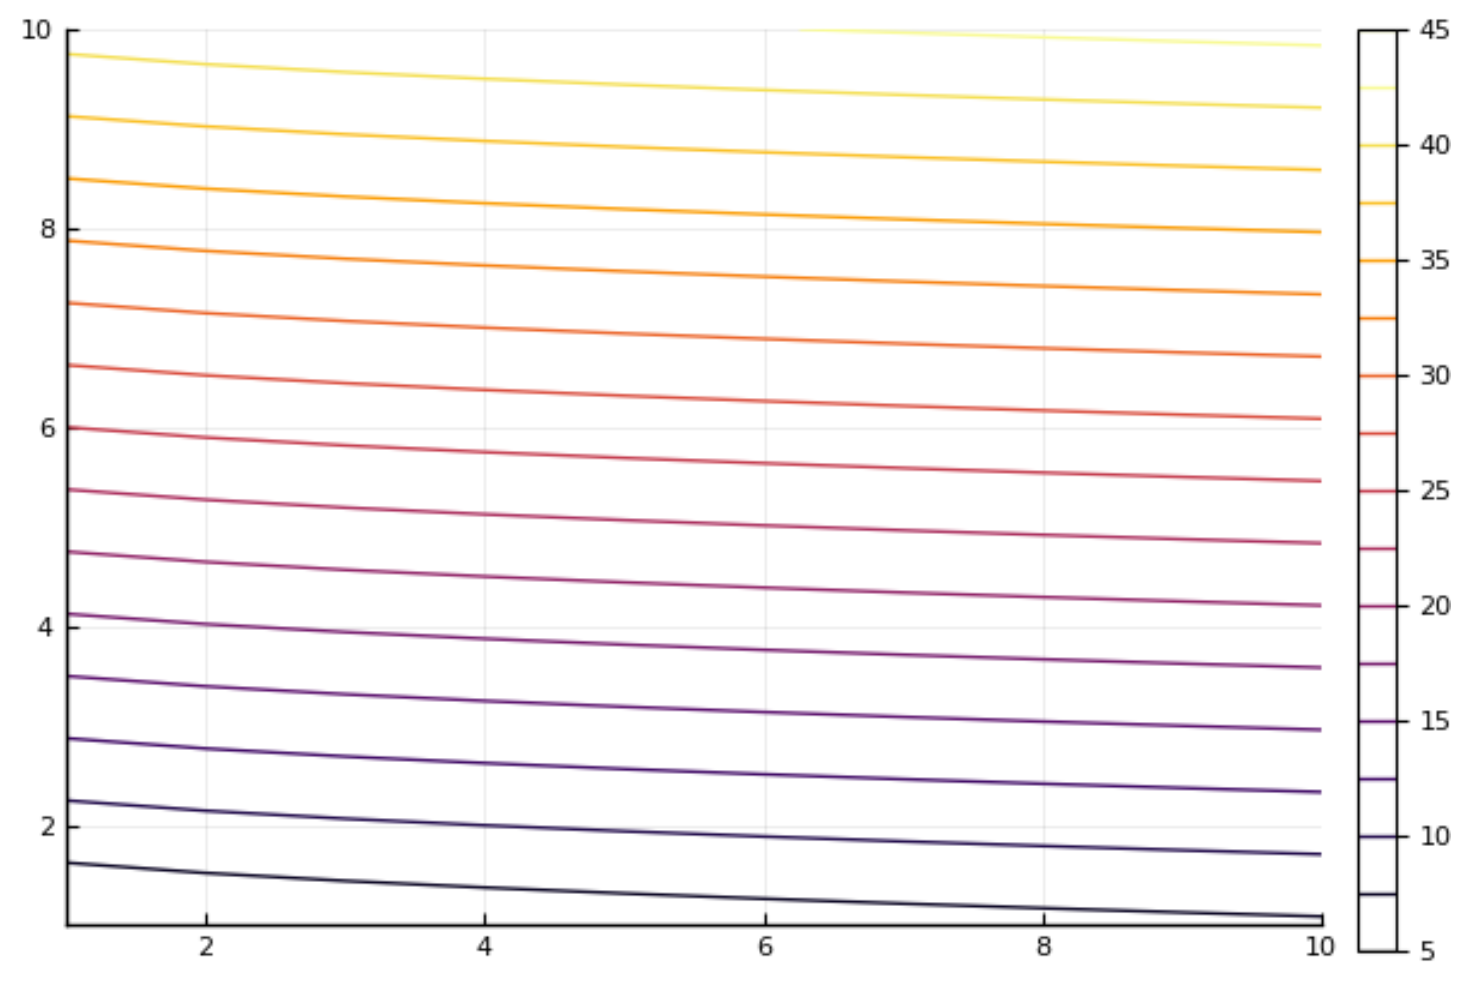
plot(1:10,1:10,Π,st=:contour)
gives:
and
plot()
for w in 1:10
    e = 1:10
    plot!(e,Π.(e,w),label="")
end
plot!()
[the default seriestype is st=:path] gives:
