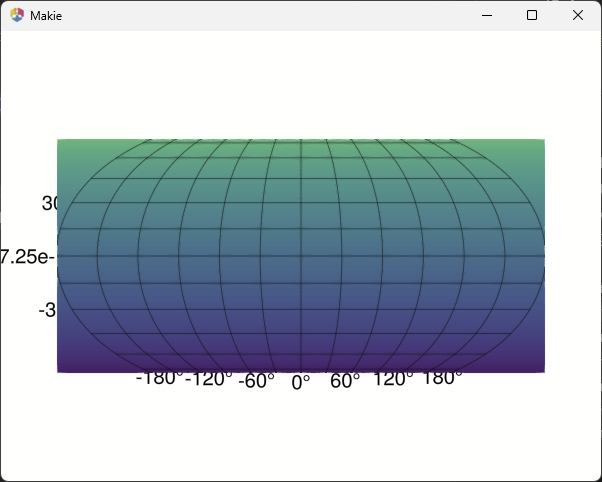
The projection in heatmap! does not seem to work (using GeoMAkie 0.7.15), the example
using GeoMakie, GLMakie
lons = -180:180
lats = -90:90
field = [exp(cosd(l)) + 3(y/90) for l in lons, y in lats]
fig = Figure()
ax = GeoAxis(fig[1,1])
#sp = surface!(ax, lons, lats, field; shading = NoShading) #(works)
sp = heatmap!(ax, lons, lats, field)
fig
gives
Also for a global lat lon Raster is does not work (the real world case). surface works, but with surface I cannot well overplot country border because they stay behind.
Any suggestion appreciated!
Heatmap will probably only work in CairoMakie. If you have regularly sampled lat/long ranges, you can use the meshimage recipe from GeoMakie, which is equivalent to heatmap but specialized for nonlinear transformations. If not, then surface would be your best bet.
There are two ways to make a surface able to be plotted over.
- You can provide it a grid of zeros as the
z argument and provide the actual data to the color kwarg, like so: sp = surface!(ax, lons, lats, zeros(size(field)); color = field, shading = NoShading)
- You can translate it back by
translate!(surface_plot, 0, 0, -maximum(surface_z)),
Either way should work. Otherwise you can also translate the plots you want in front of it forward, so translate!(your_other_plot, 0, 0, max(surface_z) + 10) for example
Thanks! - With a Raster the translate! “trick” certainly is most handy.
FWIW a brief real world example:
using Rasters, RasterDataSources, GeoMakie, Makie, ColorSchemes, NaturalEarth
elev = getraster(WorldClim{Elevation}) |> x ->  Raster(x.elev)
fig=Figure(size=(1000,600))
ga=GeoAxis(fig[1,1], dest="+proj=eqearth",  xticklabelsvisible=false, yticklabelsvisible=false, xticks=[-180, 180], yticks=[-90,90],  title="Elevation (m)")
sp = GeoMakie.surface!(ga, elev, shading=false, colormap=:terrain, colorscale=Makie.LogScale(0.001, 10))
Colorbar(fig[2,1], sp; label="[m asl.]", width=800, vertical=false)

lines!(ga, GeoMakie.coastlines(), color=:black, linewidth=0.5)
countries = NaturalEarth.naturalearth("admin_0_countries", 110)
poly!(ga, countries.geometry, color=:transparent, strokecolor=:black, strokewidth=0.5)
translate!(sp, 0,0, -maximum(elev |> skipmissing))
fig
Awesome! Looks like a pretty cool plot