Hi everyone,
I want to make a plot like this one (illustration from http://dx.doi.org/10.1118/1.4947485) with CairoMakie.jl:
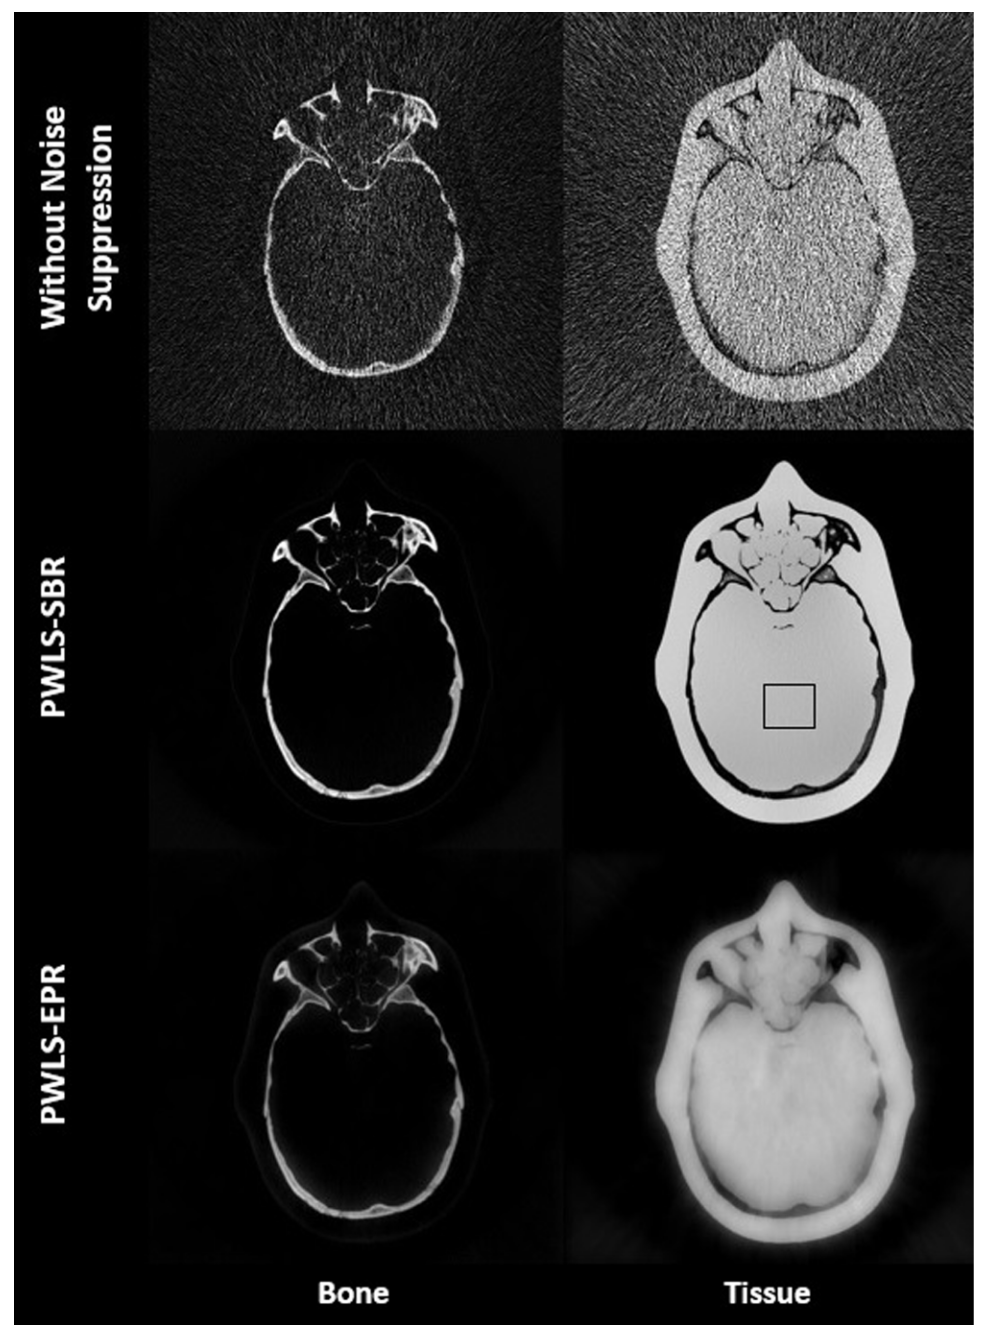
S nothing crazy. However, after several attempts (see code below), I am unable to obtain satisfactory results. The images are always tiny, and there are large borders on the sides.
For instance:
using CairoMakie
function plot_images_grid(mat1_vec, mat2_vec;
                             row_names,
                             col_names)

    @assert length(mat1_vec) == length(mat2_vec) "mat1_vec and mat2_vec must have the same length"
    n = length(mat1_vec)
    n == 0 && error("materials list is empty")

    fig = Figure(backgroundcolor = :black)

    # Row 1: column titles
    material_names_grid = fig[1, 2] = GridLayout()

    Label(material_names_grid[1, 1], col_names[1], color = :white, halign = :center)
    Label(material_names_grid[1, 2], col_names[2], color = :white, halign = :center)

    # Row 2: image grid
    images_grid = fig[2, 2] = GridLayout()
    reg_names_grid = fig[2, 1] = GridLayout()

    for i in 1:n
        Label(reg_names_grid[i, 1], row_names[i], color = :white, halign = :right, rotation = pi/2)

        ax1 = Axis(images_grid[i, 1], aspect = DataAspect())
        heatmap!(ax1, mat1_vec[i], colormap = :grays)

        ax2 = Axis(images_grid[i, 2], aspect = DataAspect())
        heatmap!(ax2, mat2_vec[i], colormap = :grays)
    end

    #colgap!(images_grid, 5)
    #rowgap!(images_grid, 50)
    # after images_grid = fig[2,2] = GridLayout()
    #colsize!(images_grid, 1, Relative(4))
    #colsize!(images_grid, 2, Relative(4))
    return fig
end


mat1_vec = [10*rand(100, 100) for _ in 1:3]
mat2_vec = [15*rand(100, 100) for _ in 1:3]
row_names = ["Region 1", "Region 2", "Region 3"]
col_names = ("Material 1", "Material 2")
fig = plot_images_grid(mat1_vec, mat2_vec;
                       row_names=row_names,
                       col_names=col_names)
display(fig)
give me:

Thanks for your help!
fdekerm