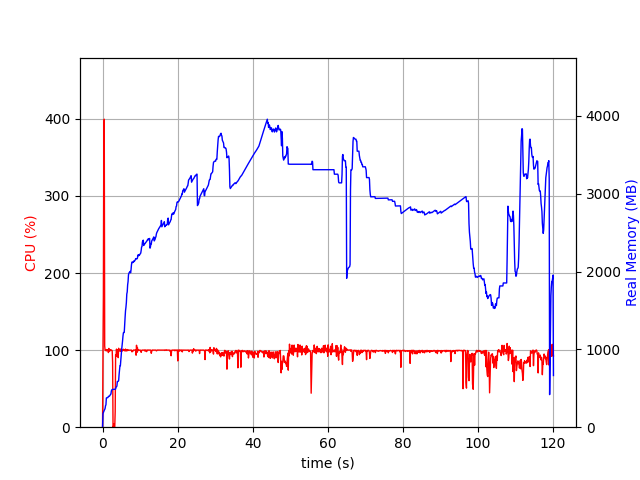
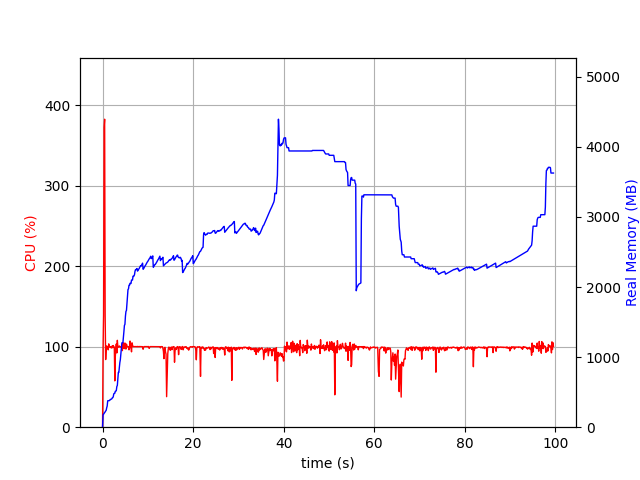
These memory attributes are also limited, as they capture the memory after calling optimize. You’d want to profile the process to compare the memory used by the different APIs. I did this using psrecord, and they look very similar:
JuMP:
C-API:
The difference in the MaxMemory usage from the solving process is from the difference in presolve behaviour:
24,26d27
< *Replay* Change 5000000 variable types
< *Replay* Update Gurobi model
< *Replay* Update Gurobi model
34c38
< Model fingerprint: 0xeef581b8
---
> Model fingerprint: 0xa3af83c3
39c43
<   Bounds range     [0e+00, 0e+00]
---
>   Bounds range     [1e+00, 1e+00]
42,47d45
< Presolve removed 0 rows and 0 columns (presolve time = 8s)...
< Presolve removed 0 rows and 5000000 columns (presolve time = 13s)...
< Presolve removed 101 rows and 5000000 columns (presolve time = 15s)...
< Presolve removed 101 rows and 5000000 columns
< Presolve time: 15.18s
< Presolve: All rows and columns removed
49c47
< Explored 0 nodes (0 simplex iterations) in 24.62 seconds (15.74 work units)
---
> Explored 0 nodes (0 simplex iterations) in 43.75 seconds (3.17 work units)
56,57c54
< *Replay* Free Gurobi model
< *Replay* Free Gurobi environment
---
> *Replay* Reached end of replay file
59a57,58
>
> *Replay* Models leaked: 1
62,63c61,62
< *Replay* Gurobi API routine runtime: 30.73s
< *Replay* Gurobi solve routine runtime: 24.91s
---
> *Replay* Gurobi API routine runtime: 24.13s
> *Replay* Gurobi solve routine runtime: 43.89s
I got this by using a recording file, which also shows the time spent in the API (a bit less in the C-API case) as well ( How do I create and use a recording file?):
The difference in the model is:
0a1
> \ Model test
17766957c17766958
<    + C4999997 + C4999998 + C4999999 <= 0
---
>    + C4999997 + C4999998 + C4999999 <= 1