There are probably more elegant approachers, but this should get you started. You will need to replace the random values with your own values.
using Plots, Random
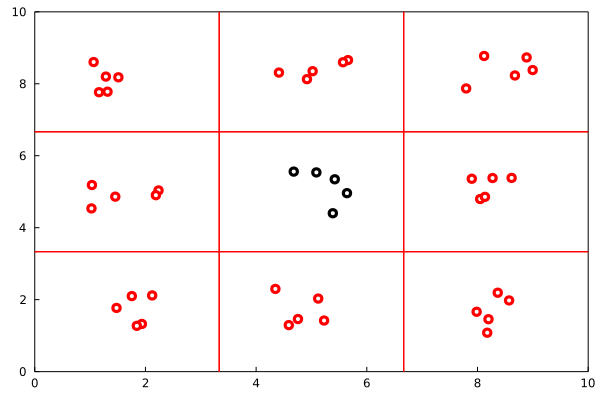
Random.seed!(5474)
n_lines = 2
min_x = 0
max_x = 10
min_y = 0
max_y = 10
mid_point = (2 + n_lines) / 2 + 1
padding = 1
xvals = range(min_x, max_x, length = n_lines + 2)
yvals = range(min_y, max_y, length = n_lines + 2)
p = plot(framestyle=:box, grid=false,
xlims=(min_x,max_x), ylims=(min_y,max_y))
for r in 2:length(xvals), c in 2:length(yvals)
rnd_x = rand(5) * (xvals[c] .- xvals[c-1] .- 2 * padding) .+ xvals[c-1] .+ padding
rnd_y = rand(5) * (yvals[r] .- yvals[r-1] .- 2 * padding) .+ yvals[r-1] .+ padding
color = (r == mid_point) && (c == mid_point) ? :black : :red
scatter!(rnd_x, rnd_y, leg=false, markerstrokecolor=color,
markercolor=:white, markerstrokewidth=4)
c ≠ length(xvals) ? hline!([xvals[c]], color=:red) : nothing
r ≠ length(xvals) ? vline!([yvals[r]], color=:red) : nothing
end
display(p)
savefig("example.png")