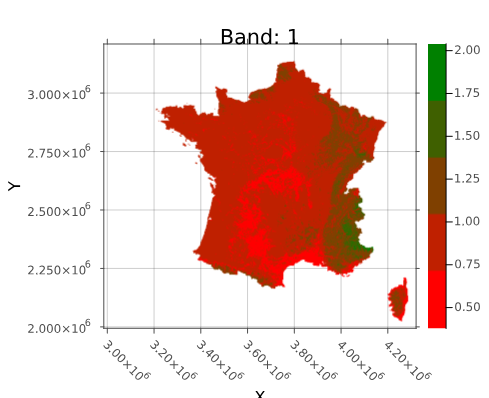
To map values from a subinterval to the same color, you must give the vector of boundary values for subintervals of an interval [a,b].
For your example boundary_vals = [0, 0.5, 0.75, 1, 1.25, 1.5, 2]. These vals define length(boundary_vals)-1 subintervals. Hence we need a vector, mycolors, of n= length(boundary_vals)-1 colors. The function constant_color returns the knots in the normalized global interval ([0,2] here), and the vector of repeating colors at the end of its subintervals, to get through interpolation a constant color between two consecutive knots.
using Colors,  FixedPointNumbers,  Interpolations,  Plots

function constant_color(boundary_vals:: Vector{Float64}, mycolors::Vector{RGB{N0f8}})
   if length(boundary_vals) != length(mycolors)+1
          error("length of boundary values should be equal to  length(mycolors)+1")
    end
    bvals = sort(boundary_vals)
    nvals = [(v-bvals[1])/(bvals[end]-bvals[1]) for v in bvals]  #normalized values
    knts = Float64[]
    colorv = RGB{N0f8}[]
    for k in 1:length(mycolors)
       append!(knts, [nvals[k], nvals[k+1]])
       append!(colorv, [mycolors[k], mycolors[k]])
   end
   knts, colorv
end

boundary_vals = [0, 0.5, 0.75, 1, 1.25, 1.5, 2]
#hexc = ["#8B0000", "#C6011F", "#FF0000", "#32CD32", "#009000", "#00674b" ]
#mycolors = [parse(RGB{N0f8}, h) for h in hexc]
mycolors = [RGB{N0f8}(0.545,0.0,0.0), RGB{N0f8}(0.776,0.004,0.122), RGB{N0f8}(1.0,0.0,0.0),
           RGB{N0f8}(0.196,0.804,0.196), RGB{N0f8}(0.0,0.565,0.0), RGB{N0f8}(0.0,0.404,0.294)]
knts, colorv = constant_color(boundary_vals, mycolors)
println(knts, "\n\n", colorv)
vals = Interpolations.deduplicate_knots!(knts)
r = [red(c)   for c in colorv]
g = [green(c) for c in colorv]
b = [blue(c)  for c in colorv]

itp_r = interpolate((vals,), r, Gridded(Constant()))
itp_g = interpolate((vals,), g, Gridded(Constant()))
itp_b = interpolate((vals,), b, Gridded(Constant()))

scale =  range(0, 1, length=255)
interp_colors = [RGB{N0f8}(itp_r(s), itp_g(s), itp_b(s)) for s in scale]
#Example
vh = reshape(2*rand(49), 7, 7) #rnd matrix with elements in [0,2]
vh[1, 5] = 0 #ensure that the ends of the  interval, [0, 2], appear in the matrix vh,
vh[4, 2] = 2 #to get a colorbar that displays the   boundary_vals
heatmap(vh, color=interp_colors, size=(375, 350))

