Suppose the i.i.d. sample Y is fitted with models A, B, and C.
In order to determine which model’s prediction is likely to be closer to the true (but unknown) distribution that generated the original sample Y, one of the standard prescriptions is to use the AIC. Select the model with the smallest AIC.
Ref. Akaike information criterion - Wikipedia
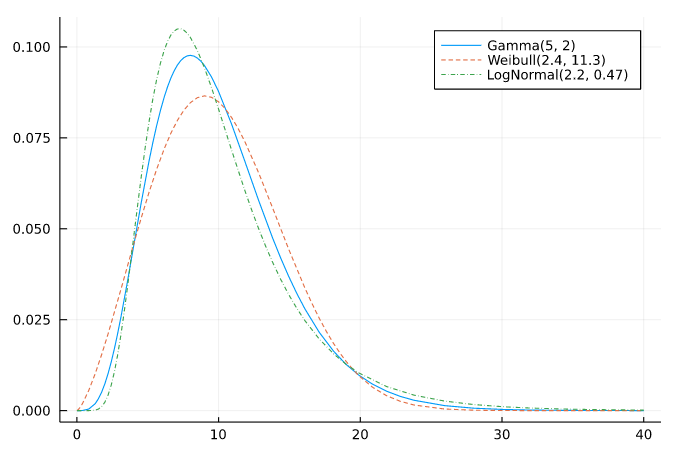
In the following example, models A, B, and C are respectively Gamma, Weibull, and LogNormal. I have experimented with three true distributions Gamma(5, 2), Weibull(2.4, 11.3), and LogNormal(2.2, 0.47). These are similar each others. Please look at the graph in the following example.
Results of a Monte Carlo simulation (10^4 iterations) with samples Y generated by Gamma(5, 2) of size 100:
     Gamma => 0.6692
   Weibull => 0.1409
 LogNormal => 0.1899
The percentage of the correct answer, Gamma, being selected is about 67 percent.
In the cases of Weibull(2.4, 11.3) and LogNormal(2.2, 0.47), the percentages of the correct answers are about 86 percent and about 81 percent, respectively.
For details, see the following code and results.
using Distributions, StatsPlots

function aic(model, Y)
    mle = fit_mle(model, Y)
    -2loglikelihood(mle, Y) + 2length(params(mle))
end

function simulate_model_selections(models, truedist, samplesize; niters = 10^4)
    selectedmodel = Vector{Int}(undef, niters)
    Threads.@threads for i in 1:niters
        Y = rand(truedist, samplesize)
        selectedmodel[i] = argmin(aic.(models, Ref(Y)))
    end
    nselected = zeros(Int, 3)
    for i in 1:niters
        nselected[selectedmodel[i]] += 1
    end
    [model => nselected[i]/niters for (i, model) in enumerate(models)]
end

models = (Gamma, Weibull, LogNormal)

a, b = 0, 40
plot(Gamma(5, 2), a, b; label="Gamma(5, 2)")
plot!(Weibull(2.4, 11.3), a, b; label="Weibull(2.4, 11.3)", ls=:dash)
plot!(LogNormal(2.2, 0.47), a, b; label="LogNormal(2.2, 0.47)", ls=:dashdot)
simulate_model_selections(models, Gamma(5, 2), 100; niters = 10^4)
3-element Vector{Pair{UnionAll, Float64}}:
     Gamma => 0.6692
   Weibull => 0.1409
 LogNormal => 0.1899
simulate_model_selections(models, Weibull(2.4, 11.3), 100; niters = 10^4)
3-element Vector{Pair{UnionAll, Float64}}:
     Gamma => 0.1427
   Weibull => 0.856
 LogNormal => 0.0013
simulate_model_selections(models, LogNormal(2.2, 0.47), 100; niters = 10^4)
3-element Vector{Pair{UnionAll, Float64}}:
     Gamma => 0.1914
   Weibull => 0.0034
 LogNormal => 0.8052
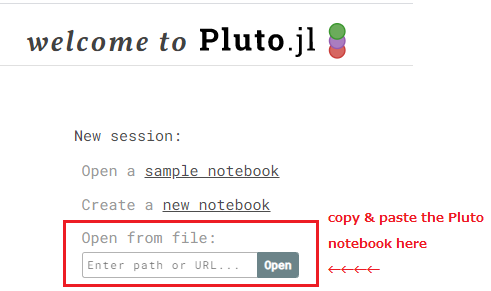
Pluto notebook: Simulation of AIC model selection - Pluto notebook.jl
You can execute in Pluto by copy-and-pasting the URL into “Open from file:” input form and click “Open” button.
Edit 1: I’m sorry. The original code works with Julia ≥ v1.7.0-beta. The edited code above works also on Julia v1.6.1.
Edit 2: Link to Pluto notebook.


