Geegee
July 17, 2025, 3:32pm
1
I have code like this and I get a figure as expected
dfrm_amp = DataFrame(px_x= x, px_y = y, z=amplitude, param_id="amplitude")
dfrm_freq = DataFrame(px_x= x, px_y = y, z=driving_freqs, param_id="rabi_freq")
dfrm_offset = DataFrame(px_x= x, px_y = y, z=offset, param_id="offset")
dfrm = vcat(dfrm_amp, dfrm_freq, dfrm_offset)
specs = mapping(x, y, im_list) * visual(Surface)
specs = data(dfrm) * mapping(:px_x, :px_y, :z, layout=:param_id) * visual(Surface)
figure_grid = draw(specs, axis=(type=Axis3, zlabel="Amplitude (counts)"))
I just would like each of the different “param_id” entries to have different “zlabel”.
Geegee
July 18, 2025, 7:09am
2
I am not sure if this is the proper way to do it, but I went back to give back a bit more control to Makie:
dfrm_amp = DataFrame(px_x= x, px_y = y, z=amplitude, param_id="amplitude")
dfrm_amp = dfrm_amp[dfrm_amp.z .> 0.0, :]
dfrm_freq = DataFrame(px_x= x, px_y = y, z=driving_freqs, param_id="rabi_freq")
dfrm_freq = dfrm_freq[dfrm_freq.z.>8.0e6, :]
dfrm_offset = DataFrame(px_x= x, px_y = y, z=offset, param_id="offset")
# trying to gain a bit more control over the plot
specs1 = data(dfrm_amp) * mapping(:px_x, :px_y, :z) * visual(Surface)
specs2 = data(dfrm_freq) * mapping(:px_x, :px_y, :z) * visual(Surface)
specs3 = data(dfrm_offset) * mapping(:px_x, :px_y, :z) * visual(Surface)
f = Figure()
fg1 = draw!(f[1, 1], specs1, axis=(type=Axis3, zlabel="Counts (a.u.)", title="Amplitude"))
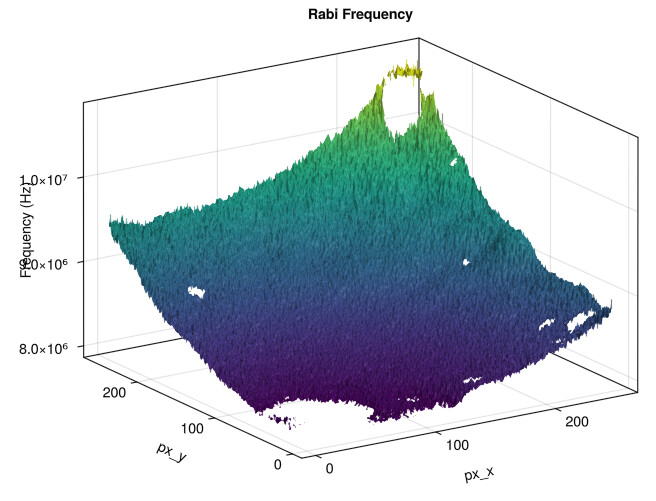
fg2 = draw!(f[1, 2], specs2, axis=(type=Axis3, zlabel="Frequency (Hz)", title="Rabi Frequency"))
fg3 = draw!(f[2, 1], specs3, axis=(type=Axis3, zlabel="Counts (a.u.)", title="Amplitude"))
f
Still there is an issue in that zlabel is moving into the axis
jules
July 18, 2025, 9:43am
3
If you want different z labels you have to have different columns, because the label is associated to the column, not grouping values. So you would use a wide format here:
dfrm_amp = DataFrame(
px_x = repeat(1:10, 10),
px_y = repeat(1:10, inner = 10),
amplitude = cumsum(randn(100)),
rabi_freq = cumsum(randn(100)),
offset = cumsum(randn(100)),
)
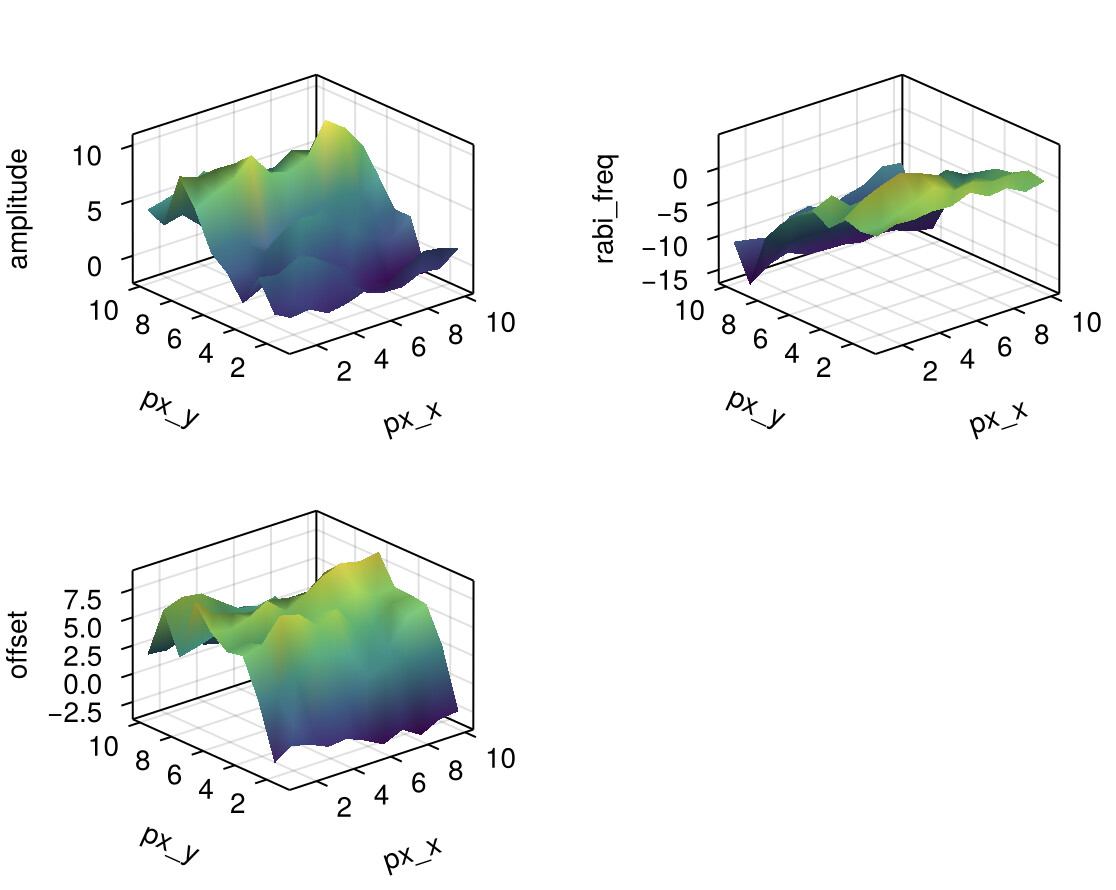
specs = data(dfrm_amp) *
mapping(
:px_x,
:px_y,
[:amplitude, :rabi_freq, :offset],
layout = dims(1)
) * visual(Surface)
draw(specs, scales(Layout = (; legend = false)), axis = (; type = Axis3))
The label distances are not adjusted automatically as with the 2D Axis because distances are less well defined in 3D. So if you get collisions, you may have to adjust zlabeloffsetprotrusions etc.