Hello to all,
I would like to make some latex annotations in julia’s Plots with gr backend outside of the plot area.
I have this example:
using Plots, LaTeXStrings

gr()

a = 3
x = collect(0:0.01:10)
y = sin.(a*x)

plt = plot(x, y,
            xlabel = "t[s]",
            legend=:bottomright,
            legend_column=1
           )

scatter!(plt, x[1:3:end], y[1:3:end],
        markersize = 1,
        legend_column=2,
        )
And have the annotations like:
How can I achieve this?
Using the GR backend getting the LaTeX annotations outside the plot is pretty simple:
annot = L"\textrm{Velocity = }\frac{1}{\sqrt{2π}}\,e^{-x^2/(2σ^2)}"

plot(x -> gs(x; σ=1);
       annotation=(6, 0.2, annot), annotationfontsize=10,
       rightmargin=5cm, legend=false)
# gs is a Gaussian distribution
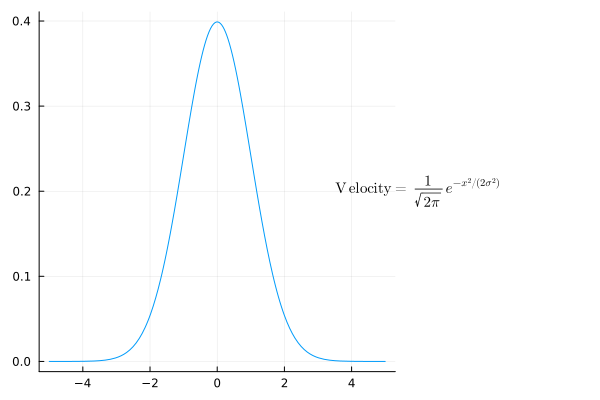
But, as you can see, although the math looks good, the kerning in the text sucks. This is because gr uses its own TeX engine instead of calling out to the real LaTeX; there will be other problems as well. If you want publication quality you can use PGFplotsX, but with this there doesn’t seem to be a straightforward way to place annotations outside the plot area (you will need step way outside the Plots interface and use pgfplots commands, or invent a kludge using subplots, etc.)
You can use Plots’ grid layout to obtain:
Plots.jl grid layout code
using LaTeXStrings, Measures, Plots; gr(dpi=600)

a = 3
x = collect(0:0.01:10)
y = sin.(a*x)

plt = plot(x, y, xlabel="t[s]", label=true, legend=:bottomright, legend_column=1)
scatter!(plt, x[1:3:end], y[1:3:end], label=true, ms=1, legend_column=2, rightmargin=-10mm)

plt2 = plot((0,NaN), c=:transparent, fg_legend=:transparent, framestyle=:none,
     label=L"a=%$(a)" * "\n\n" * L"LaTeXStrings", legend=:left, leftmargin=0mm)

plot(plt, plt2, layout=grid(1, 2, widths=[0.7, 0.3]))
Anyway to annotate latex matrices in there?
I don’t know how to automatically plot LaTeX matrices in Plots.jl, only some manual approximation.
Perhaps someone more versed in LaTeX or macros can automate it:
Plots.jl code for manual LaTeX matrix display
# (continuation of code in previous post)

Mlx = L"""
a=%$(a)

$ M =$
$\qquad \quad α \quad 0 \quad 1$
$\qquad \quad 0 \quad β \quad 2$
$\qquad \quad 1 \quad 2 \quad γ$
"""

plt2 = plot((0,NaN), c=:transparent, fg_legend=:transparent, framestyle=:none,
            label=Mlx, legend=:left, leftmargin=0mm)

plot(plt, plt2, layout=grid(1, 2, widths=[0.7, 0.3]))


