[ANN] Fatou.jl : Easily share Julia fractals

This package enables users of Julia lang to easily generate, explore, and share fractals of Julia, Mandelbrot, and Newton type. The name Fatou comes from the mathematician after whom the Fatou sets are named.

Definition (Julia set): For any holomorphic function on a complex plane, the boundary of the set of points whose result diverges when the function is iteratively evaluated at each point.

Definition (Fatou set): The Julia set’s complement is the set of fixed limit points from holomorphic recursion.

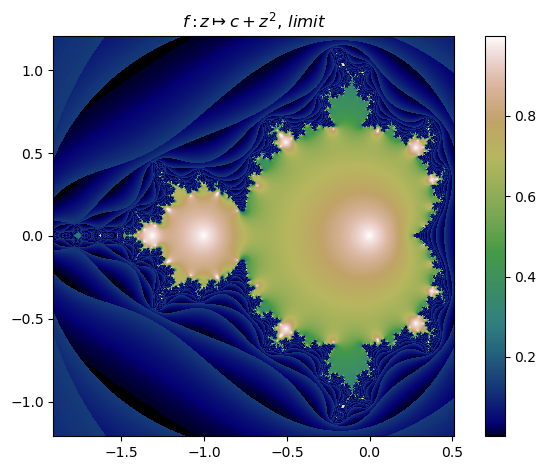
Definition (Mandelbrot set): The set of points on a complex parameter space for which the holomorphic recursion does not go to infinity from a common starting poin z_0.

Definition (Newton fractal): The Julia/Fatou set obtained from the recursion of the Newton method z \mapsto z - m\cdot f(z) / f'(z) applied to a holomorphic function.

This package is supported on versions 0.5 to 0.7, and the newest release for 0.6 and 0.7 now relies on Reduce for symbolic computations with the Newton scheme.

See the wiki for many more detailed examples. Here is one of my own discovered examples

plot(mandelbrot(:(e^(-z)+cos(c)+im*sin(c*z)),∂=[-π,π,-2,2],n=700,N=80,cmap="jet",iter=false,p=-0.3) |> fatou, bare=true)

outc

This is my favorite fractal made with the Fatou package so far, I was completely surprised by what kind of crazy images you can make with this, using the function e^{-z} + \cos(c) + \sqrt{-1}\cdot\sin(c\cdot z) .

Also, if somebody has a good suggestion about how to make this package independent of PyPlot, while still retaining the same color maps that are available from PyPlot, then I am open to ideas and suggestions.

It would be awesome if other Julians could post some of their own discoveries made with this package.

16 Likes

Cool package! I’m a bit confused about the Mandelbrot image in the wiki though. Usually the Mandelbrot set is colored on the outside of the set using the number of iterations required to escape. But I’ve never seen the Mandelbrot set colored on the inside before. What metric are you using to do this?

That’s a great question, yes normally the inside is not colored, but that is boring to the eyes!

You can find out the default information for mandelbrot in the help system

help?> mandelbrot
search: mandelbrot

  mandelbrot(::Expr;                    # primary map, (z, c) -> F
    Q::Expr     = :(abs2(z)),           # escape criterion, (z, c) -> Q
    C::Expr     = :(exp(-abs(z))*n^p),  # coloring, (z, n=iter., p=exp.) -> C
    ∂    = π/2, # Array{Float64,1}      # Bounds, [x(a),x(b),y(a),y(b)]
    n::Integer  = 176,                  # horizontal grid points
    N::Integer  = 35,                   # max. iterations
    ϵ::Number   = 4,                    # basin ϵ-Limit criterion
    iter::Bool  = false,                # toggle iteration mode
    p::Number   = 0,                    # iteration color exponent
    m::Number   = 0,                    # Newton multiplicity factor
    seed::Number= 0.0+0.0im,            # Mandelbrot seed value
    x0          = nothing,              # orbit starting point
    orbit::Int  = 0,                    # orbit cobweb depth
    depth::Int  = 1,                    # depth of function composition
    cmap::String= "")                   # imshow color map

  Define Mandelbrot basin in Fatou

and you can in fact use any of your own metrics for it via the keywords.

1 Like

To answer this question specifically, Fatou has essentially two different plotting modes controlled by the iter boolean keyword. In the example you referenced, the coloring function e^{-|z|}\cdot n^p is used with the limit values of z, which causes a coloring value that also varies on the inside of the set.

However, if you want to get the traditional iteration count display of the Mandelbrot set, then you need to set the iter keyword to true as such

mandelbrot(:(z^2+c),n=700,N=20,∂=[-1.91,0.51,-1.21,1.21],iter=true,cmap="gist_earth") |> fatou |> plot

mandel

Then the coloring scheme works as you typically expect it. The title of the plot tells you what kind it is.

Hooray! With the release of Julia 1.0.1, the Fatou package finally works again. There was a compatibility issue that prevented it from working in Julia 1.0, so you will need to use 1.0.1 to run Fatou. Also, there will be a stackoverflow error if you only have using Fatou, this can be avoided by saying using Reduce,Fatou.

Would be awesome if some people could post code snippets here for their favorite fractal discoveries.

Out of curiosity, have you experienced with multi-threading for evaluating each pixel (I see some Threads stuff so I guess, yes) and how have you found the scaling to be?

Yes, indeed, Fatou detects the number of Julia threads available at the startup and reports it back. When a specified Fatou set is computed, multi-threading is used to compute the pixels. If you have 8 threads, then the computation will be 8 times faster. Since each pixel is independent of any other pixel, it doesn’t matter in what order or on how many threads it is computed, the more you use the faster it is. I have this in startup.jl

ENV["JULIA_NUM_THREADS"] = 8

This enables the multi-threading for more than 1 thread. Here is the code

https://github.com/chakravala/Fatou.jl/blob/master/src/Fatou.jl#L271-L273

Maybe off topic but I am unable to install it in 1.0.1. It fails with following error

(v1.0) pkg> add Fatou
  Updating registry at `~/.julia/registries/General`
  Updating git-repo `https://github.com/JuliaRegistries/General.git`
 Resolving package versions...
ERROR: Unsatisfiable requirements detected for package Fatou [5f923234]:
 Fatou [5f923234] log:
 ├─possible versions are: [0.0.1-0.0.3, 0.1.0-0.1.3, 0.2.0, 1.0.0] or uninstalled
 ├─restricted to versions * by an explicit requirement, leaving only versions [0.0.1-0.0.3, 0.1.0-0.1.3, 0.2.0, 1.0.0]
 └─restricted by julia compatibility requirements to versions: uninstalled — no versions left

Not sure what is the cause of that. Have you tried with dev Fatou instead?

dev Fatou works. I checked the metadata repo and it was updated there so I didn’t know what has caused the error in my previous message.

This is an announcement update, Fatou version 1.0.1 has been released, which now has a significant performance improvement due to the suggestion by @ckoe-bccms with parametric types

This should fix the issue with the high memory allocation for large n, allowing bigger fractals, faster

julia> newton(:(z^3-1);n=3500)|>fatou;
  1.004239 seconds (541 allocations: 36.706 KiB)

The testing behavior of the package is a bit weird on some platforms, but with PyPlot, it should work.

Out of curiosity, what was the timing before type parameters, for running that code?

In this post, I had a comparison of n=1500 grid, which took 19 seconds before, while only taking 0.17 seconds in the new version with the parametric types.

It’s probably due to assigning the Fatou.Define object to parallel threads, because the iteration function depends on two Bool values in that object and also functions in it, which might become unnecessary now due to the information provided by the parametric type. Now, only the complex number is variable.

1 Like

This here is a fractal which is notoriously difficult to calculate, now it can be calculated at higher resolution

newton(:(z^(4.0+3.0im)-1),m=2.1,∂=π,n=2000,N=27,cmap="terrain") |> fatou |> plot
 13.986463 seconds (541 allocations: 36.706 KiB)

With these improvements, it still takes 14 seconds for 2000 pixels, but previously 500 pixels was reasonable

complex-fractal

That is using N=27 iterations maximum. This one is a slow fractal to compute. Post some more fractals!

2 Likes

The newly tagged release of Fatou enables support for ImageInTerminal and deprecates the requirement for having PyPlot on your Julia installation. However, it continues to support PyPlot if it is installed.

Here’s what ImageInTerminal looks like with some Fatou.FilledSet displayed.

If you want your favorite plotting program to be compatible, you are welcome to make a PR

5 Likes

I mean you could implement the plotting with recipes instead. All that is needed is RecipesBase, which is 200 loc with zero dependencies and no exports, and then the user would need Plots to plot it.
There are lots of colormaps available: Colors · Plots
If the color gradients from matplotlib can be made available within the MIT license here we would be happy to take a PR adding them so that this functionality becomes available. But - the jet, cubehelix and gist_earth color schemes are not perceptually uniform. Why do you choose this set of palettes?

2 Likes

To summarize, the reason why I used PyPlot is because it has lots of nice color maps, that’s why I made the package specifically compatible with PyPlot and not Plots, but anyone is welcome to add Plots support.

RecipesBase looks interesting, perhaps I will add that feature soon

I choose those color schemes on purpose, because I think they look the most interesting for fractals.

Some of them like jet,cubehelix are already available with ColorSchemes, but gist_earth is not available yet. The ColorSchemes can be used for ImageInTerminal, while the matplotlib are used for PyPlot. A large amount of them are compatible, but not all of them. I would like to see more also.

Great! I can see your colours do look interesting for fractals. If you do attempt to write recipes I think we could put those three in the misc library

I can easily add new schemes to ColorSchemes.jl, I just ran out of ideas for new ones… :slight_smile:

1 Like

Could you add the missing ones from here https://matplotlib.org/examples/color/colormaps_reference.html

For example, such as ocean, gist_earth, gnuplot which are all missing, then color maps will be much more portable across different plotting environments.