# Two questions about axises for matrix plot
**URL:** https://discourse.julialang.org/t/two-questions-about-axises-for-matrix-plot/41972
**Category:** Visualization
**Created:** [June 24, 2020, 10:01am UTC](https://discourse.julialang.org/t/two-questions-about-axises-for-matrix-plot/41972 "2020-06-24T10:01:22Z")
**Posts on this page:** 3
**Page:** 1
### Author:  [@Torkel](https://discourse.julialang.org/u/Torkel)
#### Post date: [June 24, 2020, 10:01am UTC](https://discourse.julialang.org/t/two-questions-about-axises-for-matrix-plot/41972/1 "2020-06-24T10:01:22Z")
I have this code
```julia
plot(1:20,1:20,rand(RGB{Float64}, 20, 20))
```
Here the y-axis goes from top to bottom, and the x-axis from left to right. But what if I want both to start from the bottom left corner? I can easily transform the color matrix for this, but how do I make the ticks happen? I want ticks for `1` on the bottom of the y-axis and at the left of the x-axis. This code has no effect:
```julia
plot(20:-1:1,1:20,rand(RGB{Float64}, 20, 20))
```
(except for creating a white border to the left)
using
```julia
plot(1:20,20:-1:1,rand(RGB{Float64}, 20, 20))
```
have a similar (lack of) effect.
Next question, say that the two axes have different scales, so I want something like:
```julia
plot(10:10:200,1:20,rand(RGB{Float64}, 20, 20))
```
then the plot itself gets wrapped (and it becomes very hard to see what happens in y-direction). Is there a way to set the scale of the ticks, without actually re-scaling the entire plot?
---
### Author:  [@josephmarturano](https://discourse.julialang.org/u/josephmarturano)
#### Post date: [June 25, 2020, 3:21pm UTC](https://discourse.julialang.org/t/two-questions-about-axises-for-matrix-plot/41972/2 "2020-06-25T15:21:22Z")
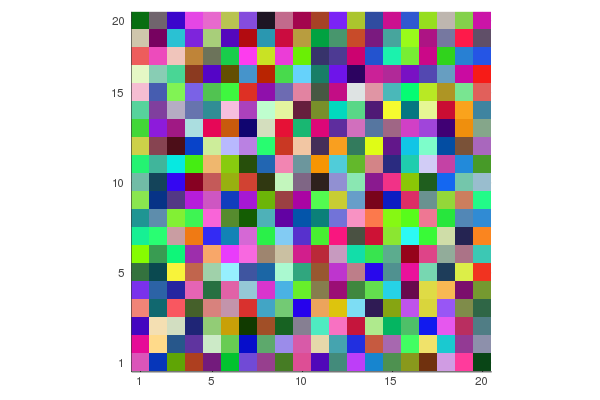
You can pass a tuple to the keyword `xticks` and `yticks`, where the first argument is the position of the ticks and the second argument is the text. To answer the first question, you could set the ticks in the following way - note the tuple on the `yticks` argument, and how I reverse the order of the ticks:
```julia
using Plots
colorplot = plot(1:20,1:20,rand(RGB{Float64}, 20, 20), xticks=([1,5,10,15,20]), yticks=([1,5,10,15,20], string.([20, 15, 10, 5, 1])))
savefig(colorplot, "colorplot.png")
```
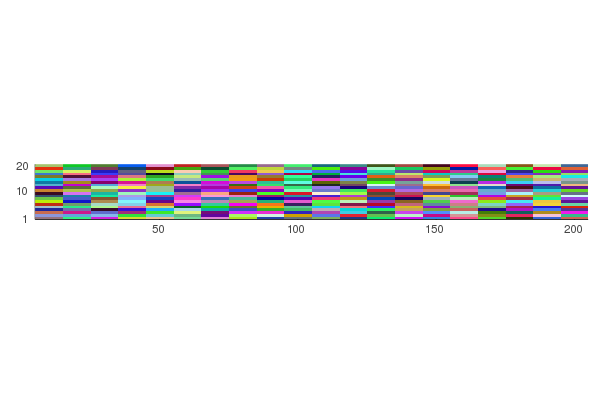
I do not fully understand what you are trying to accomplish with the second question. But again, you set the y-ticks position and content in the same way:
```julia
using Plots
colorplot_aspectratio = plot(10:10:200,1:20,rand(RGB{Float64}, 20, 20), yticks=([1,10,20], string.([20, 10, 1])))
savefig(colorplot_aspectratio, "colorplot_aspectratio.test_png")
```
---
### Author:  [@Torkel](https://discourse.julialang.org/u/Torkel)
#### Post date: [June 26, 2020, 7:47pm UTC](https://discourse.julialang.org/t/two-questions-about-axises-for-matrix-plot/41972/3 "2020-06-26T19:47:49Z")
Thank you for the help. For future reference, I got answers to a similar question at [https://github.com/JuliaPlots/Plots.jl/issues/2814](https://github.com/JuliaPlots/Plots.jl/issues/2814) as well.