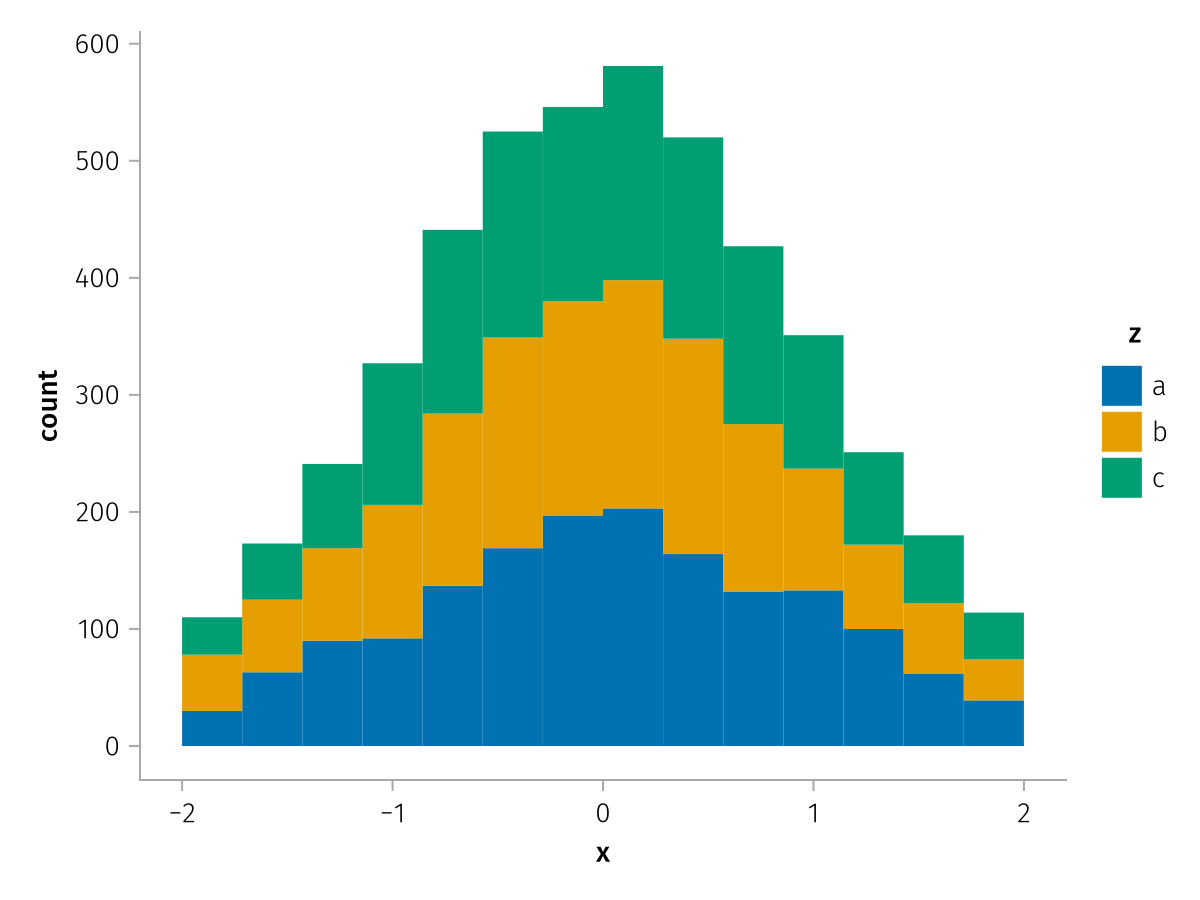
# Stacked Histogram
**URL:** https://discourse.julialang.org/t/stacked-histogram/133248
**Category:** General Usage
**Tags:** plotting, makie, cairomakie
**Created:** [October 17, 2025, 7:58pm UTC](https://discourse.julialang.org/t/stacked-histogram/133248 "2025-10-17T19:58:20Z")
**Posts on this page:** 7
**Page:** 1
### Author:  [@Chrysoberyl](https://discourse.julialang.org/u/Chrysoberyl)
#### Post date: [October 17, 2025, 7:58pm UTC](https://discourse.julialang.org/t/stacked-histogram/133248/1 "2025-10-17T19:58:21Z")
Is there a way to make a stacked histogram in Makie like [Stacked histogram on a log scale — seaborn 0.13.2 documentation](https://seaborn.pydata.org/examples/histogram_stacked.html)?

The documentation only has examples about multiple histograms.
---
### Author:  [@Yuan-Ru-Lin](https://discourse.julialang.org/u/Yuan-Ru-Lin)
#### Post date: [October 17, 2025, 8:05pm UTC](https://discourse.julialang.org/t/stacked-histogram/133248/2 "2025-10-17T20:05:42Z")
Maybe @jling knows how one can do that in FHist.jl?
---
### Author:  [@Chrysoberyl](https://discourse.julialang.org/u/Chrysoberyl)
#### Post date: [October 17, 2025, 8:17pm UTC](https://discourse.julialang.org/t/stacked-histogram/133248/3 "2025-10-17T20:17:58Z")
If there is no way to do it in Makie directly I can write a patch for Makie.
---
### Author:  [@jling](https://discourse.julialang.org/u/jling)
#### Post date: [October 17, 2025, 9:49pm UTC](https://discourse.julialang.org/t/stacked-histogram/133248/4 "2025-10-17T21:49:02Z")
FHist.jl has this functionality if you use our histograms:

> **[Makie Plotting · FHist.jl](https://moelf.github.io/FHist.jl/stable/notebooks/makie_plotting/)**
>
> Documentation for FHist.jl.
---
### Author:  [@technocrat](https://discourse.julialang.org/u/technocrat)
#### Post date: [October 17, 2025, 10:42pm UTC](https://discourse.julialang.org/t/stacked-histogram/133248/5 "2025-10-17T22:42:31Z")
Something along these lines
```julia-auto
using CairoMakie, StatsBase
function stacked_hist!(ax, datasets; bins, colors)
@assert length(datasets) == length(colors)
edges = collect(bins)
counts = [fit(Histogram, d, edges).weights for d in datasets]
M = hcat(counts...)
C = cumsum(M; dims=2)
width = edges[2] - edges[1]
centers = @view(edges[1:end-1]) .+ width/2
for i in eachindex(centers)
bottom = 0.0
for j in 1:size(C,2)
top = C[i,j]
# rectangle polygon corners
x0 = centers[i] - width/2
x1 = centers[i] + width/2
poly!(ax,
Point2f[(x0,bottom), (x1,bottom), (x1,top), (x0,top)],
color = colors[j])
bottom = top
end
end
ax
end
f = Figure()
ax = Axis(f[1,1], xlabel="Value", ylabel="Count")
stacked_hist!(ax,
[randn(1000), randn(1000) .+ 1, randn(1000) .+ 2];
bins = -4:0.5:6,
colors = [:tomato, :dodgerblue, :seagreen]
)
f
```

---
### Author:  [@Chrysoberyl](https://discourse.julialang.org/u/Chrysoberyl)
#### Post date: [October 19, 2025, 5:34am UTC](https://discourse.julialang.org/t/stacked-histogram/133248/6 "2025-10-19T05:34:18Z")
I wrote a PR for multi-histogram plot in Makie:
>
>
> \# Description
>
> This PR adds a multi-histogram plotting function \`multihist!\` l…ike \[seaborn's stacked histogram\](https://seaborn.pydata.org/examples/histogram\_stacked.html). Below is an example of stacked vs dodged histograms.
>
> Vide https://discourse.julialang.org/t/stacked-histogram/133248
>
> !\[comparison\](https://github.com/user-attachments/assets/c02eca24-7aa7-4b60-9a9a-3c79ae6e03f2)
>
>
> \`\`\`julia
> using CairoMakie
>
> data1 = rand(100) .\* 2.0 .- 1.0
> data2 = rand(100) .\* 2.0
>
> fig = Figure(size=(600,300))
>
> multihist!(
> Axis(fig\[1, 1\]),
> \[data1, data2\];
> colormap = :Set3\_10,
> label = \["red", "blue"\],
> positioning = :stack,
> )
> multihist!(
> Axis(fig\[1, 2\]),
> \[data1, data2\];
> colormap = :Set3\_10,
> label = \["red", "blue"\],
> positioning = :dodge,
> )
> save("/tmp/stacked.svg", fig)
>
> \`\`\`
>
> \## Type of change
>
> Delete options that do not apply:
>
> \- \[X\] New feature (non-breaking change which adds functionality)
>
> \## Checklist
>
> \- \[X\] Added an entry in CHANGELOG.md (for new features and breaking changes)
> \- \[X\] Added or changed relevant sections in the documentation
> \- \[X\] Added unit tests for new algorithms, conversion methods, etc.
> \- \[X\] Added reference image tests for new plotting functions, recipes, visual options, etc.
---
### Author:  [@RomeoV](https://discourse.julialang.org/u/RomeoV)
#### Post date: [October 19, 2025, 7:06am UTC](https://discourse.julialang.org/t/stacked-histogram/133248/7 "2025-10-19T07:06:21Z")
I’m pretty sure AoG can do this, see the third plot in the histogram docs: [Analyses | AlgebraOfGraphics](https://aog.makie.org/stable/reference/analyses)
```julia-auto
specs = data(df) * mapping(:x, stack=:z, color=:z) * histogram()
draw(specs)
```