@Humphrey_Lee I started a github gist, which is a quick implementation of marginal histograms in Gadfly. Plenty of room for improvement, please make comments there.
This one will go into the Gallery… It seems to be useful for a lot of people.
@Mattriks. Saw your first plot. Nice! My 2cents comments:-
- Add axis into both histograms [can be frequency (normalized) or counts (un-normalized)];
- Add cumulative line into both histograms; &
- If the plot data is of multiple groups, e.g. by colors, the histogram should reflect that as well, by showing stacked histogram.
Can you share how can I use this module gg.jl?
gg.jl is a file, so include("gg.jl").
Thanks. Successfully replicated your example. Will do more tests to incorporate my 3 suggestions.
Custom guides could be developed in a separate package (e.g. ggplot has ggExtra). Note the coding of aesthetic guides (e.g. color, shape etc) is under ![]() in Gadfly (e.g. Stacked guides by Mattriks · Pull Request #1423 · GiovineItalia/Gadfly.jl · GitHub), so structural changes may occur that affect external development.
in Gadfly (e.g. Stacked guides by Mattriks · Pull Request #1423 · GiovineItalia/Gadfly.jl · GitHub), so structural changes may occur that affect external development.
Saw some commits in git repository for PR#1423. Not sure how much this has matured. Last test (~10 days ago), it did not allow additional layer. Please let me know I can help to test.
PR #1423 was merged, so it’s available on master (in julia, ]add Gadfly#master).
You’ll have to explain what you mean by “it did not allow an additional layer” (please provide example code).
I probably did it the wrong way. Don’t know how to use/ call the merged features. I’ve pulled in latest Gadfly. My code is below.
using Gadfly, Cairo
include(raw"D:\codes\Git\gg.jl")

X = randn(1000, 2)
X1 = randn(1000, 2)

p = Gadfly.plot(x=X[:,1], y=X[:,2], Geom.point, gg.margins(),
    layer(x=X1[:,1], y=X1[:,2], Geom.path, order=3, Gadfly.Theme(default_color=colorant"red")),
    color=[colorant"deepskyblue"],
    Gadfly.Theme(panel_stroke="gray", default_color="gray80")
)

draw(PDF("marginalhistogram.pdf", 5inch, 5inch), p)

l1 = layer(x=X[:,1], y=X[:,2], Geom.point, gg.margins())
l2 = layer(x=X1[:,1], y=X1[:,2], Geom.path, order=3, Gadfly.Theme(default_color=colorant"red"))

p1 = plot(x=X[:,1], y=X[:,2], Geom.point, gg.margins(), l2)

draw(PDF("marginalhistogram1.pdf", 5inch, 5inch), p1)
The error messages.
WARNING: replacing module gg.
LoadError: Layers can't be used with elements of type Main.gg.Marginal
Stacktrace:
 [1] error(::String) at .\error.jl:33
 [2] add_plot_element!(::Array{Layer,1}, ::Main.gg.Marginal) at ...
The error happens in this line: l1 = layer(x=X[:,1], y=X[:,2], Geom.point, gg.margins()). The output of gg.margins() is a Guide, and you can’t put guides in layers (see the Layers section in the Gadfly docs). You can put Guides directly in the plot statement, as you have already done in your plot p and plot p1.
`
If this is implemented as Guide, I’m not sure how extensible it will be. I also noticed the marginal_histogram in R’s ggExtra is also pretty primitive. See code sample below to demo my enhancement proposal. In scenario #1, I might want to do histogram for the Geom.point only, excluding Geom.line. In scenario #2, the histogram is not detail enough. Stacked histogram would be helpful.
using Gadfly, Cairo
include(raw"D:\codes\Git\gg.jl")
X = randn(10, 2)
X1 = randn(10, 2) .- 10
l1 = layer(x=X[:,1], y=X[:,2], Geom.point)
l2 = layer(x=X1[:,1], y=X1[:,2], Geom.line, order=3, Gadfly.Theme(default_color=colorant"red"))
p1 = plot(l1, l2, gg.margins())
draw(PDF("marginalhistogram1.pdf", 5inch, 5inch), p1)
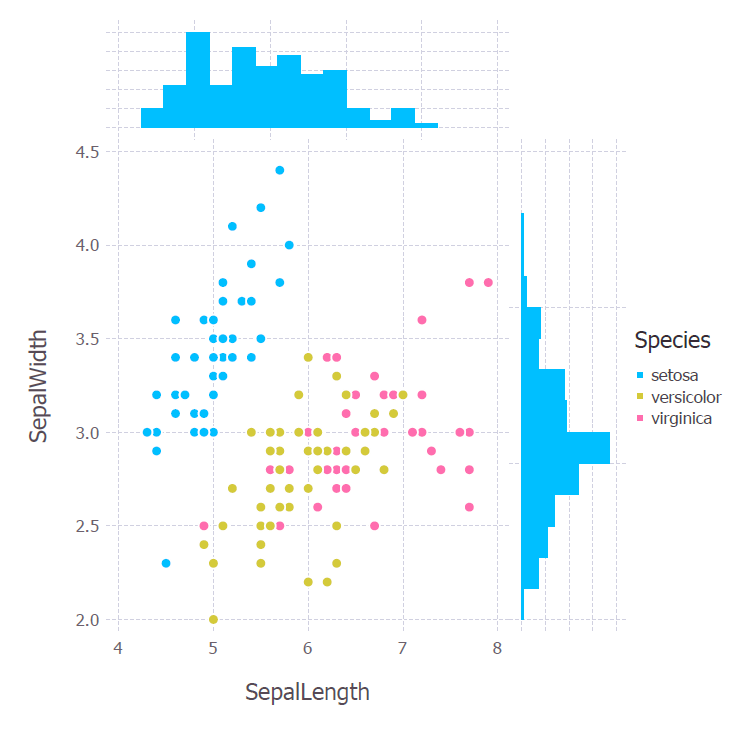
using RDatasets
D = dataset("datasets", "iris")
p3 = plot(D, x="SepalLength", y="SepalWidth", color="Species", Geom.point, gg.margins())
draw(PDF("marginalhistogram2.pdf", 5inch, 5inch), p3)
marginalhistogram1

marginalhistogram2
Both these enhancements can be developed, but at the moment I’m busy with Roadmap · Issue #1385 · GiovineItalia/Gadfly.jl · GitHub and other issues.
Tried running your code, but encountered error. I’ve updated to latest Gnuplot (1.3.0) and even tried #master branch. Error below.
LoadError: type NamedTuple has no field TERM_XMIN
in expression starting at untitled-e7bdc683e45977abea23bd6e2e41964d:17
getproperty at Base.jl:33 [inlined]
gpmargins(::Symbol) at Gnuplot.jl:2281
gpmargins() at Gnuplot.jl:2278
top-level scope at untitled-e7bdc683e45977abea23bd6e2e41964d:17
Second question is how customizable are the histograms? For example, if the plot are multi-layers/ stacked plots, can the histogram applies to certain layers (or combination)? If the scatter consists of multi-color/ shape, can the histogram turn into stacked histogram, representing/ mimicking the shape/ color distribution? Thanks.
I guess it’s because you’re running in Jupyter or Juno, while gpmargins() and gpranges() requires an actual gnuplot terminal.
Try run the above code in a simple Julia REPL. Or try the following in Jupyter:
using Gnuplot

x = randn(1000);
y = randn(1000);

# Overall plot margins (normalized in the range 0:1)
margins = (l=0.08, r=0.98, b=0.13, t=0.98)

# Right and top margins of main plot
right, top = 0.8, 0.75

# Gap between main plot and histograms
gap  = 0.015

# Axis range
xr = [-3,3]
yr = [-3,3]

# Main plot
@gp "set multiplot"
@gp :- 1 ma=margins rma=right tma=top xr=xr yr=yr :-
@gp :-   x y "w p notit" xlab="X" ylab="Y"

# Histogram on X
h = hist(x, nbins=10)
@gp :- 2 ma=margins bma=top+gap rma=right xr=xr yr=[NaN,NaN] :-
@gp :-   "set xtics format ''" "set ytics format ''"  xlab="" ylab="" :-
bs = fill(h.binsize, length(h.bins));
@gp :-   h.bins h.counts./2 bs./2 h.counts./2 "w boxxy notit fs solid 0.4" :-

# Histogram on Y
h = hist(y, nbins=10)
@gp :- 3 ma=margins lma=right+gap tma=top xr=[NaN,NaN] yr=yr :-
@gp :-     "unset xrange" :-
bs = fill(h.binsize, length(h.bins));
@gp :-   h.counts./2 h.bins h.counts./2 bs./2 "w boxxy notit fs solid 0.4" :-
@gp
Concerning your second question: you have complete flexibility for the horizontal histogram on the top (see set style histogram in the gnuplot manual), while for the vertical histogram on the right you need to calculate the bounding coordinates of each histogram "bar, and use the color/filling properties of the boxxyerror style.
Tried the original code in REPL, still error → ERROR: LoadError: type NamedTuple has no field TERM_XMIN Stacktrace: [1] getproperty at .\Base.jl:33 [inlined]
Run the new code above in REPL, it works.