# Rotate grid in plots
**URL:** https://discourse.julialang.org/t/rotate-grid-in-plots/73454
**Category:** General Usage
**Tags:** plotting, plots
**Created:** [December 21, 2021, 8:42pm UTC](https://discourse.julialang.org/t/rotate-grid-in-plots/73454 "2021-12-21T20:42:42Z")
**Posts on this page:** 8
**Page:** 1
### Author:  [@Christopher\_Fisher](https://discourse.julialang.org/u/Christopher_Fisher)
#### Post date: [December 21, 2021, 8:42pm UTC](https://discourse.julialang.org/t/rotate-grid-in-plots/73454/1 "2021-12-21T20:42:43Z")
I would like to superimpose a rotated grid to represent an alternative coordinate system in a plot. Right now I essentially translate an angle to a slope and plot the lines. When the angle parameter theta is zero, the grid is in the standard position and it works correctly. However, as the lines are rotated, the size of each cell shrinks to fit the plot, which throws off the coordinates. Is there a work around, or did I do something completely wrong instead?
using Plots
θ = .25
xs = range(-10, 10, length=21)
β1 = tan(θ \* π)
v\_grid = map(β0 → β0 .+ β1 \* xs, range(-10, 10, length=21))
h\_grid = map(β0 → β0 .- β1 \* xs, range(-10, 10, length=21))
```julia
plot(
xs,
v_grid,
color = :black,
linewidth = .5,
framestyle = :origin,
xlims = (-10, 10),
ylims = (-10, 10),
grid = false,
leg = false,
)
plot!(
h_grid,
xs,
color = :black,
linewidth = .5,
)
```

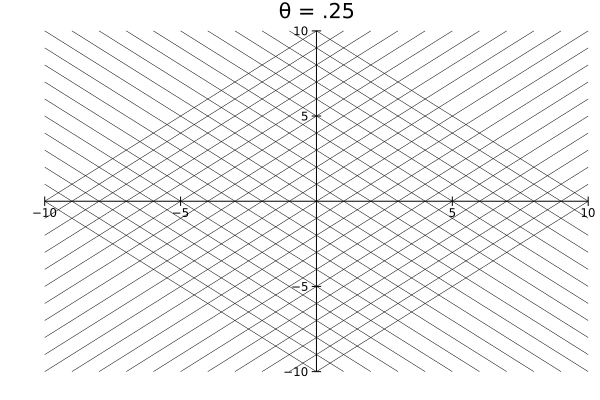
---
### Author:  [@John\_Gibson](https://discourse.julialang.org/u/John_Gibson)
#### Post date: [December 21, 2021, 9:30pm UTC](https://discourse.julialang.org/t/rotate-grid-in-plots/73454/2 "2021-12-21T21:30:35Z")
Do you want the original coordinate grid to be rigidly rotated? If so you need to use an orthogonal rotation matrix `Q` to transform `[x; y]` points to `Q' * [x; y]`. I’ll revise your code to do this shortly.
---
### Author:  [@Christopher\_Fisher](https://discourse.julialang.org/u/Christopher_Fisher)
#### Post date: [December 21, 2021, 9:48pm UTC](https://discourse.julialang.org/t/rotate-grid-in-plots/73454/3 "2021-12-21T21:48:46Z")
Yes. I believe it is a rigid rotation that I need. In other words, the size of each cell should be the same after rotation. Thank you for offering to help. Much appreciated.
---
### Author:  [@John\_Gibson](https://discourse.julialang.org/u/John_Gibson)
#### Post date: [December 21, 2021, 9:57pm UTC](https://discourse.julialang.org/t/rotate-grid-in-plots/73454/4 "2021-12-21T21:57:27Z")
This is probably not the most elegant, but it does the trick
```julia
θ = 0.2
N = 11
xs = range(-10, 10, length=N)
ys = range(-10, 10, length=N)
us = ones(N)
Q = [cos(θ) sin(θ) ; -sin(θ) cos(θ)] # rotation matrix
plot()
for n=1:N
xline = [xs ;; ys[n]*us] # a horizontal line
yline = [xs[n]*us ;; ys] # a vertical line
xlineQ = xline*Q # rotated horizontal line
ylineQ = yline*Q # rotated vertical line
plot!(xlineQ[:,1], xlineQ[:,2], color=:black, label="")
plot!(ylineQ[:,1], ylineQ[:,2], color=:black, label="")
end
plot!(aspect_ratio=:equal)
```

---
### Author:  [@Christopher\_Fisher](https://discourse.julialang.org/u/Christopher_Fisher)
#### Post date: [December 21, 2021, 10:01pm UTC](https://discourse.julialang.org/t/rotate-grid-in-plots/73454/5 "2021-12-21T22:01:39Z")
Thank you again! It looks like this should work. I will try to integrate it with my code once I get a chance
---
### Author:  [@Christopher\_Fisher](https://discourse.julialang.org/u/Christopher_Fisher)
#### Post date: [December 21, 2021, 10:07pm UTC](https://discourse.julialang.org/t/rotate-grid-in-plots/73454/6 "2021-12-21T22:07:04Z")
It looks like everything will work after some minor tweaks. I will add this as a solution.
---
### Author:  [@rafael.guerra](https://discourse.julialang.org/u/rafael.guerra)
#### Post date: [December 22, 2021, 10:27am UTC](https://discourse.julialang.org/t/rotate-grid-in-plots/73454/7 "2021-12-22T10:27:16Z")
As a complement to John’s nice solution, one could exploit the functionality of `Plots.jl` which allows plotting matrices (_and arrays of matrices_) by columns to write this in a compact form, without loops:
```julia
rotx(x,y,θ) = cosd(θ)*x - sind(θ)*y # use scalar functions
roty(x,y,θ) = sind(θ)*x + cosd(θ)*y # for easier broadcasting
x, y = range(-15, 15, step=1), range(-15, 15, step=1) # grid ranges and steps
xx, yy = x .* ones(length(y))', ones(length(x)) .* y' # create master meshgrid
xr, yr = rotx.(xx,yy,20), roty.(xx,yy,20) # create rotated meshgrid
using Plots; gr(dpi=600)
plot( [xr, xr'], [yr, yr'], lc=:blues, lw=0.2) # plot master grid
plot!([xx, xx'], [yy, yy'], lc=:black, lw=0.2) # plot rotate grid
plot!(legend=false, lim=(-10,10), box=:origin, ratio=1)
```

---
### Author:  [@Christopher\_Fisher](https://discourse.julialang.org/u/Christopher_Fisher)
#### Post date: [December 23, 2021, 9:42am UTC](https://discourse.julialang.org/t/rotate-grid-in-plots/73454/8 "2021-12-23T09:42:45Z")
Very nice! As always, thanks for your help.