# Polar plot with 0° at the nadir?
**URL:** https://discourse.julialang.org/t/polar-plot-with-0-at-the-nadir/92119
**Category:** Visualization
**Created:** [December 26, 2022, 2:11am UTC](https://discourse.julialang.org/t/polar-plot-with-0-at-the-nadir/92119 "2022-12-26T02:11:04Z")
**Posts on this page:** 12
**Page:** 1
### Author:  [@rmfritz](https://discourse.julialang.org/u/rmfritz)
#### Post date: [December 26, 2022, 2:11am UTC](https://discourse.julialang.org/t/polar-plot-with-0-at-the-nadir/92119/1 "2022-12-26T02:11:04Z")
Is there any simple way to do this? The default is 0° on the right.
---
### Author:  [@empet](https://discourse.julialang.org/u/empet)
#### Post date: [December 26, 2022, 10:52am UTC](https://discourse.julialang.org/t/polar-plot-with-0-at-the-nadir/92119/2 "2022-12-26T10:52:09Z")
Setting in `PlotlyJS.Layout` polar=attr(angularaxis\_rotation=270)` does the job, i.e. the origin is rotated 270 degrees:
```julia
using PlotlyJS
fig1 = Plot(scatterpolar(r = [1.5, 1,2, 2.5, 3, 4, 2.75],
theta = [35, 70, 120, 155, 205, 240, 310],
mode = "markers+lines"),
Layout(font_size=10,
width=400, height=400,
polar=attr(angularaxis_rotation=270)))
```
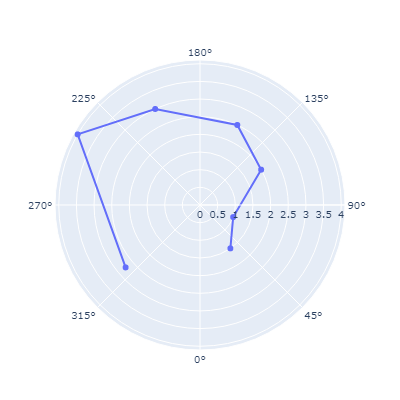
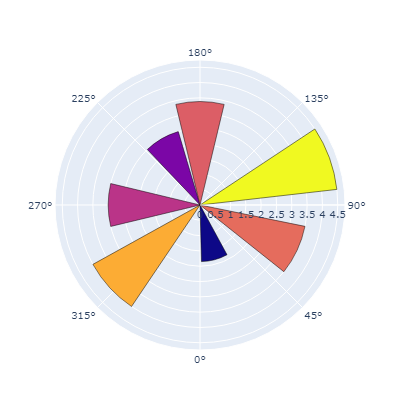
and for barpolar:
```julia
r=[3.5, 1.85, 2.5, 4.5, 4, 3.38, 3]
fig2 = Plot(barpolar(r=r,
theta=[65, 15, 210, 110, 312.5, 180, 270],
marker_color=r,
marker_line_color="black", #line around each bar
marker_line_width=0.5),
Layout(font_size=10, width=400, height=400,
polar=attr(angularaxis_rotation=270)))
```
---
### Author:  [@rmfritz](https://discourse.julialang.org/u/rmfritz)
#### Post date: [December 26, 2022, 4:16pm UTC](https://discourse.julialang.org/t/polar-plot-with-0-at-the-nadir/92119/3 "2022-12-26T16:16:19Z")
Thanks. I was trying to do this with plots and GR, but it doesn’t look like GR supports this (or maybe I can’t find the parameter), so I’ll try your suggestion next.
---
### Author:  [@Dan](https://discourse.julialang.org/u/Dan)
#### Post date: [December 26, 2022, 6:23pm UTC](https://discourse.julialang.org/t/polar-plot-with-0-at-the-nadir/92119/4 "2022-12-26T18:23:56Z")
Yeah, doesn’t seem `GR` supports this.
But this can be forced by digging into Plots.jl.
Try the following code:
> **Big function here...**
>
> ```julia
> import Plots: gr_polaraxes
>
> function gr_polaraxes(rmin::Real, rmax::Real, sp::Plots.Subplot)
> GR.savestate()
> xaxis = sp[:xaxis]
> yaxis = sp[:yaxis]
>
> orig_α = 0:45:315
> a = orig_α .+ 90
> sinf = sind.(a)
> cosf = cosd.(a)
> α = collect(circshift(orig_α, 2))
> rtick_values, rtick_labels = Plots.get_ticks(sp, yaxis, update = false)
>
> # draw angular grid
> if xaxis[:grid]
> Plots.gr_set_line(
> xaxis[:gridlinewidth],
> xaxis[:gridstyle],
> xaxis[:foreground_color_grid],
> sp,
> )
> Plots.gr_set_transparency(xaxis[:foreground_color_grid], xaxis[:gridalpha])
> for i in eachindex(α)
> GR.polyline([sinf[i], 0], [cosf[i], 0])
> end
> end
>
> # draw radial grid
> if yaxis[:grid]
> Plots.gr_set_line(
> yaxis[:gridlinewidth],
> yaxis[:gridstyle],
> yaxis[:foreground_color_grid],
> sp,
> )
> Plots.gr_set_transparency(yaxis[:foreground_color_grid], yaxis[:gridalpha])
> for i in eachindex(rtick_values)
> r = (rtick_values[i] - rmin) / (rmax - rmin)
> if r <= 1.0 && r >= 0.0
> GR.drawarc(-r, r, -r, r, 0, 359)
> end
> end
> GR.drawarc(-1, 1, -1, 1, 0, 359)
> end
>
> # prepare to draw ticks
> Plots.gr_set_transparency(1)
> GR.setlinecolorind(90)
> GR.settextalign(GR.TEXT_HALIGN_CENTER, GR.TEXT_VALIGN_HALF)
>
> # draw angular ticks
> if xaxis[:showaxis]
> GR.drawarc(-1, 1, -1, 1, 0, 359)
> for i in eachindex(α)
> x, y = GR.wctondc(1.1 * sinf[i], 1.1 * cosf[i])
> GR.textext(x, y, string((360 - α[i]) % 360, "^o"))
> end
> end
>
> # draw radial ticks
> if yaxis[:showaxis]
> for i in eachindex(rtick_values)
> r = (rtick_values[i] - rmin) / (rmax - rmin)
> if r <= 1.0 && r >= 0.0
> x, y = GR.wctondc(0.05, r)
> Plots.gr_text(x, y, Plots._cycle(rtick_labels, i))
> end
> end
> end
> GR.restorestate()
> end
>
> ```
This did it on my machine:
```julia
julia> plot(r, 0, 2π, proj=:polar, lims=(0,1.5));
```
gives:

Note, the series didn’t really change, only the axis labels, so it might be easiest to transform the data series to fit the new labels (or dig more into the code).
Plots.jl did not intend for this feature to exist… yet.
The changed bit is the:
```julia
orig_α = 0:45:315
a = orig_α .+ 90
α = collect(circshift(orig_α, 2))
```
at the beginning.
---
### Author:  [@rmfritz](https://discourse.julialang.org/u/rmfritz)
#### Post date: [December 26, 2022, 9:41pm UTC](https://discourse.julialang.org/t/polar-plot-with-0-at-the-nadir/92119/5 "2022-12-26T21:41:35Z")
Thanks. On my slightly different function call this draws an error message, unfortunately. I suspect I’ve got the function call wrong.
`plot(deg2rad.(pho.verticalangles), pho.candelavalues[6,:], 0, 2π, proj = :polar, m = 2)`
pho.verticalangles and pho.candelavalues[6,:] are both Vector{Float32} of length 11.
> Couldn’t process recipe args: (Vector{Float32}, Vector{Float32}, Int64, Float64)
I’ve gone with the PlotlyJS solution…sure wish I could get it going in IJulia, but it works fine in the basic Julia REPL.
But that is probably another thread.
---
### Author:  [@Dan](https://discourse.julialang.org/u/Dan)
#### Post date: [December 27, 2022, 12:10am UTC](https://discourse.julialang.org/t/polar-plot-with-0-at-the-nadir/92119/6 "2022-12-27T00:10:54Z")
Try without the `0, 2π`:
```julia
plot(deg2rad.(pho.verticalangles), pho.candelavalues[6,:]; proj = :polar, m = 2)
```
---
### Author:  [@rmfritz](https://discourse.julialang.org/u/rmfritz)
#### Post date: [December 27, 2022, 12:23am UTC](https://discourse.julialang.org/t/polar-plot-with-0-at-the-nadir/92119/7 "2022-12-27T00:23:03Z")
Thanks, again!
Your code plus the following command produces the output I was looking for:
`plot(deg2rad.(pho.verticalangles .- 90), pho.candelavalues[6,:], proj = :polar, m = 2)`
---
### Author:  [@rmfritz](https://discourse.julialang.org/u/rmfritz)
#### Post date: [December 27, 2022, 2:38am UTC](https://discourse.julialang.org/t/polar-plot-with-0-at-the-nadir/92119/8 "2022-12-27T02:38:12Z")
And I’ve filed a GR enhancement request. It seems like such an obvious thing, and yet…
---
### Author:  [@Ahmed\_Salih](https://discourse.julialang.org/u/Ahmed_Salih)
#### Post date: [April 1, 2023, 7:42pm UTC](https://discourse.julialang.org/t/polar-plot-with-0-at-the-nadir/92119/9 "2023-04-01T19:42:35Z")
Has this been implemented now and if so, how to do it?
---
### Author:  [@rmfritz](https://discourse.julialang.org/u/rmfritz)
#### Post date: [April 1, 2023, 8:01pm UTC](https://discourse.julialang.org/t/polar-plot-with-0-at-the-nadir/92119/10 "2023-04-01T20:01:12Z")
I don’t know. Back in 2022 I opened an [enhancement request](https://github.com/sciapp/gr/issues/168) and Josef Heinen said it would be picked up in the next release, but I’m not sure that’s occurred yet.
---
### Author:  [@Ahmed\_Salih](https://discourse.julialang.org/u/Ahmed_Salih)
#### Post date: [April 1, 2023, 8:18pm UTC](https://discourse.julialang.org/t/polar-plot-with-0-at-the-nadir/92119/11 "2023-04-01T20:18:36Z")
Thank you - I made a follow up comment, to hopefully show more interest in the option 🙂
Kind regards
---
### Author:  [@Ahmed\_Salih](https://discourse.julialang.org/u/Ahmed_Salih)
#### Post date: [April 3, 2023, 5:54pm UTC](https://discourse.julialang.org/t/polar-plot-with-0-at-the-nadir/92119/12 "2023-04-03T17:54:59Z")
Code by @jheinen:
```julia
using GR
angles = LinRange(0, 2pi, 40)
radii = LinRange(0, 2, 40)
polar(angles, radii, theta_zero_location="S", theta_direction=-1)
```
>
>
> \*\*Enhancement request\*\*
>
> I recently tried using GR via Plots.jl to produce a p…olar plot of luminaire photometry. I was quite surprised to discover that there no way to change the polar coordinates used by GR. No matter what I did, 𝜃 = 0° was always at the right of the chart and type C photometry is usually presented with 𝜃 = 0° at the bottom.
>
> So this is a request for the ability to rotate the axis of the polar graph.
>
> Dan, over on the Julia Discourse board, \[provided\](https://discourse.julialang.org/t/polar-plot-with-0-at-the-nadir/92119/4?u=rmfritz) a Julia function which made it work, and so I have graphs to present, showing what is currently supported and what I actually wanted.
>
> What I could get from unmodified GR:
> !\[image\](https://user-images.githubusercontent.com/276178/209601648-8bf08add-14eb-468a-8635-82e51886cad7.png)
>
>
> What I wanted:
> !\[image\](https://user-images.githubusercontent.com/276178/209601436-4fc361cf-1487-4d93-b79e-52c8cd0d6dd3.png)
Is the way to do it now
Kind regards