# Plotting surface without interpolating at discontinuity
**URL:** https://discourse.julialang.org/t/plotting-surface-without-interpolating-at-discontinuity/95279
**Category:** General Usage
**Tags:** question, plotting, plots
**Created:** [February 27, 2023, 3:58pm UTC](https://discourse.julialang.org/t/plotting-surface-without-interpolating-at-discontinuity/95279 "2023-02-27T15:58:04Z")
**Posts on this page:** 6
**Page:** 1
### Author:  [@NoFishLikeIan](https://discourse.julialang.org/u/NoFishLikeIan)
#### Post date: [February 27, 2023, 3:58pm UTC](https://discourse.julialang.org/t/plotting-surface-without-interpolating-at-discontinuity/95279/1 "2023-02-27T15:58:04Z")
I am attempting to plot a function that has a discontinuity, consider for example,
```julia
function f(x, y)
if x^2 + y^2 ≤ 1/2
return 1.
else
return 0.
end
end
```
If I use the `surface` function from `Plots.jl` I obtain the following plot
```julia
surface(-1:0.01:1, -1:0.01:1, f)
```
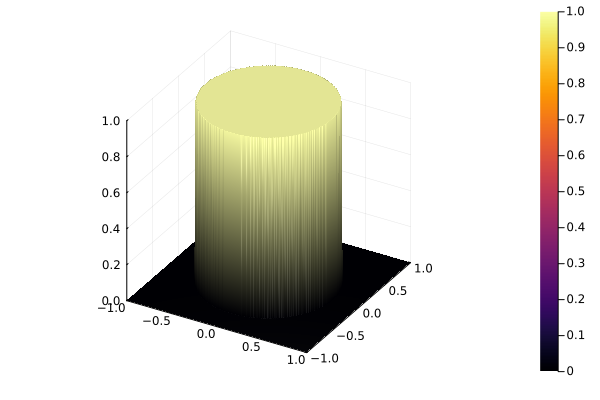
Is there a way to plot the function without `surface` automatically interpolating the discontinuity points?
---
### Author:  [@rafael.guerra](https://discourse.julialang.org/u/rafael.guerra)
#### Post date: [February 27, 2023, 5:56pm UTC](https://discourse.julialang.org/t/plotting-surface-without-interpolating-at-discontinuity/95279/2 "2023-02-27T17:56:20Z")
I don’t know of an automatic method, but in general, to obtain the same result, `NaN`s are inserted around the discontinuities to prevent interpolation:

> **Plots.jl code**
>
> ```julia
> using Plots; plotlyjs()
>
> function f(x, y, δ)
> r = x^2 + y^2
> if r ≤ 1/2 - δ
> return 1.0
> elseif r ≥ 1/2 + δ
> return 0.0
> end
> return NaN
> end
>
> δ = 0.01
> x = y = -1.0:δ:1.0
> Plots.surface(x, y, (x,y)->f(x,y,δ))
>
> # QC mask of NaN:
> heatmap(x, y, (x,y)->f(x,y,δ), ratio=1, lims=(-1,1))
>
> ```
---
### Author:  [@NoFishLikeIan](https://discourse.julialang.org/u/NoFishLikeIan)
#### Post date: [February 27, 2023, 6:12pm UTC](https://discourse.julialang.org/t/plotting-surface-without-interpolating-at-discontinuity/95279/3 "2023-02-27T18:12:16Z")
Thank you for your answer!
Yeah, I thought about this, but in my case the discontinuity points are hard to compute. They are determined by an implicit equation, which I would have to solve with a root finder. I can do that, but it is not that elegant.
---
### Author:  [@rafael.guerra](https://discourse.julialang.org/u/rafael.guerra)
#### Post date: [February 27, 2023, 7:30pm UTC](https://discourse.julialang.org/t/plotting-surface-without-interpolating-at-discontinuity/95279/4 "2023-02-27T19:30:42Z")
Ok, check if this automatic method could work in your case:
```julia
using Plots; plotlyjs(size=(800,600), dpi=600)
f(x, y) = x^2 + y^2/4 ≤ 1/2 ? 1. : 0.
x = -1.0:0.01:1.0
y = -2.0:0.01:2.0
z = f.(x,y')
ϵ = 0.5
∇x = vcat(diff(z, dims=1), zeros(1, length(y)))
∇y = hcat(diff(z, dims=2), zeros(length(x)))
z[hypot.(∇x, ∇y) .> ϵ] .= NaN
surface(x, y, z', xlabel="x", ylabel="y", zlabel="z")
```
_ **NB:** changed the circular disc to an ellipse for easier debugging_

---
### Author:  [@jheinen](https://discourse.julialang.org/u/jheinen)
#### Post date: [March 1, 2023, 9:49am UTC](https://discourse.julialang.org/t/plotting-surface-without-interpolating-at-discontinuity/95279/5 "2023-03-01T09:49:22Z")
… should also work with GR (or Plots with the default backend):

---
### Author:  [@rafael.guerra](https://discourse.julialang.org/u/rafael.guerra)
#### Post date: [March 1, 2023, 10:15am UTC](https://discourse.julialang.org/t/plotting-surface-without-interpolating-at-discontinuity/95279/6 "2023-03-01T10:15:26Z")
@jheinen, Plots.jl with gr() backend seems to exhibit several bugs on this example.
Bug on `aspect_ratio=:equal`, which is not applied to the z-axes:
```julia
surface(x, y, z', ratio=:equal)
```
Bug on the color scale limits if we set `zlims` to fix the `aspect_ratio` bug above:
```julia
surface(x, y, z', ratio=:equal, zlims=(-2,2))
```