# Plotting in Julia like Matlab plots
**URL:** https://discourse.julialang.org/t/plotting-in-julia-like-matlab-plots/44997
**Category:** General Usage
**Tags:** plotting, 3d, gnuplot
**Created:** [August 15, 2020, 3:30pm UTC](https://discourse.julialang.org/t/plotting-in-julia-like-matlab-plots/44997 "2020-08-15T15:30:49Z")
**Posts on this page:** 9
**Page:** 1
### Author:  [@sriharitn](https://discourse.julialang.org/u/sriharitn)
#### Post date: [August 15, 2020, 3:30pm UTC](https://discourse.julialang.org/t/plotting-in-julia-like-matlab-plots/44997/1 "2020-08-15T15:30:49Z")
I’m trying to plot 3D surface plot like the figure below (source: [Wikipedia](https://commons.wikimedia.org/wiki/File:Rosenbrock_function.svg)):

Here is my attempt in `julia`;
```julia
x = [-2:0.05:2;]
y = [-1:0.05:3;]
z = (1 .-x').^2 .+ 100 .*(y.-x'.^2).^2
minZ = minimum(z[:]);
maxZ = maximum(z[:]);
c = minZ .+ (maxZ-minZ).*log.(1 .+z .- minZ) ./ log(1+maxZ-minZ)
Plots.plot(x,y,z,st=:surface,color=cgrad(:jet,c),
xlabel = "x",ylabel="y",zlabel="f(x,y)")
```

Here are my questions:
1. How can I get the julia plot color map appear like Matlab, even log scale does not work.
2. View (camera) for Matlab plot Azimuth and Elevation is (-30,30) while julia plot camera option does not work at all.`camera = (-30,30)`. Negative values does not seem to work in `camera` option. How can me make the view (x and y option) appear similar to matlab.
Thank you
---
### Author:  [@dpsanders](https://discourse.julialang.org/u/dpsanders)
#### Post date: [August 15, 2020, 3:43pm UTC](https://discourse.julialang.org/t/plotting-in-julia-like-matlab-plots/44997/2 "2020-08-15T15:43:06Z")
This recent post may be useful:
> [@Colormap logscale using Plot](https://discourse.julialang.org/t/colormap-logscale-using-plot/44759):
>
> I’m trying to build a 3D surface plot with color in log10 scale. I just want the color to be in the log10 scale NOT the actual values itself. N = 51 x = range(-10, stop = 10, length = N) y = x f(x,y)=x^2+y^2 Plots.plot(x,y,f,st=:surface,color=:jet,camera=(25,65)) See below: [output] Here is the output with Logscale created using GNUPLOT.
---
### Author:  [@BLI](https://discourse.julialang.org/u/BLI)
#### Post date: [August 15, 2020, 5:04pm UTC](https://discourse.julialang.org/t/plotting-in-julia-like-matlab-plots/44997/3 "2020-08-15T17:04:23Z")
Do you use the `gr` backend? Seems like `camera` doesn’t work with that backend.
I did some hacking, and get this (imperfect) result:

Some intro things:
```julia
using Plots; pyplot()
COL = append!([colorant"blue",colorant"lime"],range(colorant"yellow",colorant"red",length=20))
```
gives:
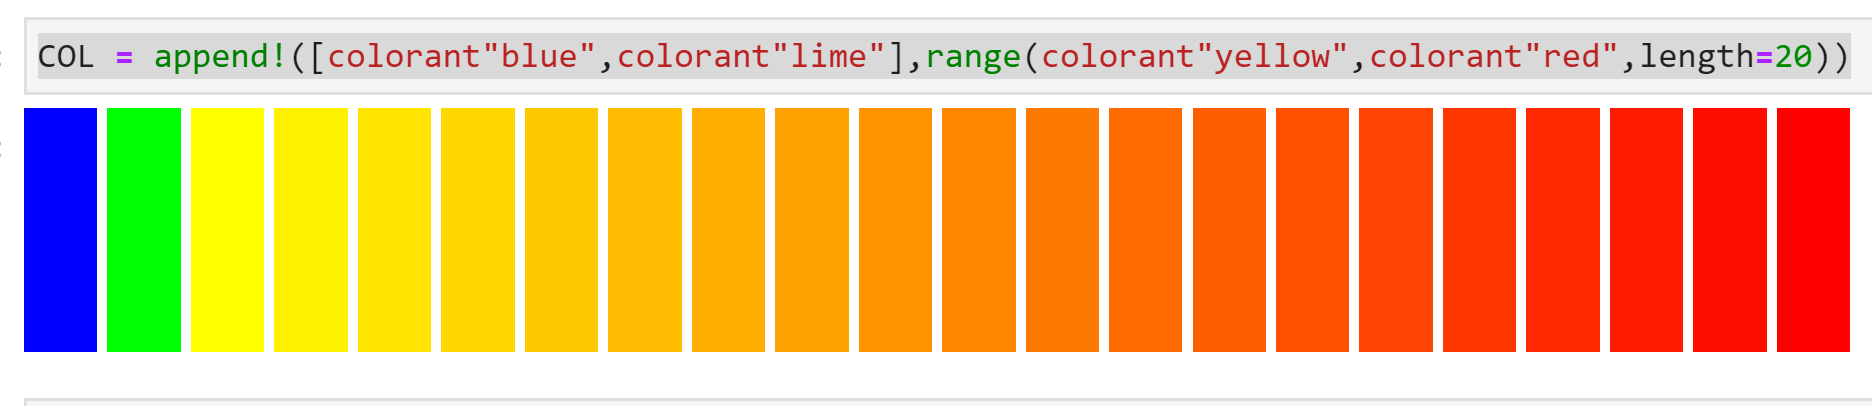
You can play around to get a better vector of colors. Next, I apply these colors to the `cgrad` method, and add `scale=:exp`:
```julia
Plots.plot(x,y,z,st=:surface,color=cgrad(COL,scale=:exp),#cgrad(:jet,c),
xlabel = "x",ylabel="y",zlabel="f(x,y)",camera=(-30,30))
```
This gives the introductory plot.
See, e.g., `https://www.w3schools.com/colors/colors_names.asp` for names of HTML colors – I think most of them are supported in `Plots` – you just write the HTML name in lowercase.
Also, see `http://docs.juliaplots.org/latest/generated/colorschemes/` for predefined color gradients.
---
### Author:  [@gcalderone](https://discourse.julialang.org/u/gcalderone)
#### Post date: [August 15, 2020, 5:04pm UTC](https://discourse.julialang.org/t/plotting-in-julia-like-matlab-plots/44997/4 "2020-08-15T17:04:40Z")
You may get reasonably close with the following code (using [Gnuplot.jl](https://github.com/gcalderone/Gnuplot.jl)):
```julia
using Gnuplot
x = [-2:0.05:2;]
y = [-1:0.05:3;]
z = (1 .-x').^2 .+ 100 .*(y.-x'.^2).^2
minZ = minimum(z[:]);
maxZ = maximum(z[:]);
c = minZ .+ (maxZ-minZ).*log.(1 .+z .- minZ) ./ log(1+maxZ-minZ)
@gsp "set xyplane at 0" palette(:jet1) cbr=extrema(c) :-
@gsp :- x y z c "w pm3d notit"
@gsp :- xlab="x" ylab="y" "set zlabel 'f(x,y)' rot parallel" :-
@gsp :- xr=[-2.01,NaN] yr=[-1.01, NaN]
@gsp :- "set view 50, 240"
@gsp :- "set grid vertical"
@gsp :- "set grid ztics"
```
and save the image with:
```julia
save(output="test.png", term="pngcairo size 800,600")
```
The result is:

(Edit: added grid lines)
---
### Author:  [@sriharitn](https://discourse.julialang.org/u/sriharitn)
#### Post date: [August 15, 2020, 7:01pm UTC](https://discourse.julialang.org/t/plotting-in-julia-like-matlab-plots/44997/5 "2020-08-15T19:01:49Z")
This is excellent. I’m very familiar with gnuplot, thanks for sharing the package and the code. One question, can I save the plot in Julia environment, and further use to add features? Lets say for example, I would like to add 3D quiver plot using Julia commands on top of the surface plot, is that possible, or should I still do this in gnuplot?
---
### Author:  [@sriharitn](https://discourse.julialang.org/u/sriharitn)
#### Post date: [August 15, 2020, 8:12pm UTC](https://discourse.julialang.org/t/plotting-in-julia-like-matlab-plots/44997/6 "2020-08-15T20:12:52Z")
Awesome, thank you. Is there a way to rotate “f(x,y)” zlabel and move away from the axis? Thanks again.
---
### Author:  [@anon67531922](https://discourse.julialang.org/u/anon67531922)
#### Post date: [August 15, 2020, 9:05pm UTC](https://discourse.julialang.org/t/plotting-in-julia-like-matlab-plots/44997/7 "2020-08-15T21:05:19Z")
Despite all the efforts, I think the Matlab version is still most beautiful 😍
I’d love to see any of our more artistically inclined data viz experts try to improve the Julia version 😊
---
### Author:  [@BLI](https://discourse.julialang.org/u/BLI)
#### Post date: [August 16, 2020, 3:49pm UTC](https://discourse.julialang.org/t/plotting-in-julia-like-matlab-plots/44997/8 "2020-08-16T15:49:11Z")
Something like this?
```julia
Plots.plot(x,y,z,st=:surface,color=cgrad(COL,scale=:exp),#cgrad(:jet,c),
xlabel = "x",ylabel="y",zlabel="f(x,y)",zguidefontrotation=45,camera=(-30,30))
```
leads to:

---
### Author:  [@sriharitn](https://discourse.julialang.org/u/sriharitn)
#### Post date: [August 16, 2020, 4:39pm UTC](https://discourse.julialang.org/t/plotting-in-julia-like-matlab-plots/44997/9 "2020-08-16T16:39:47Z")
Perfect, yes.