You can see an example how 2d matrices can be used with AoG here Intro to AoG - V - Alternative input data formats | AlgebraOfGraphics
Mind the note that this part of the API is not really considered stable, it’s a side effect that this is possible but in general AoG is intended to work with same-length array arguments.
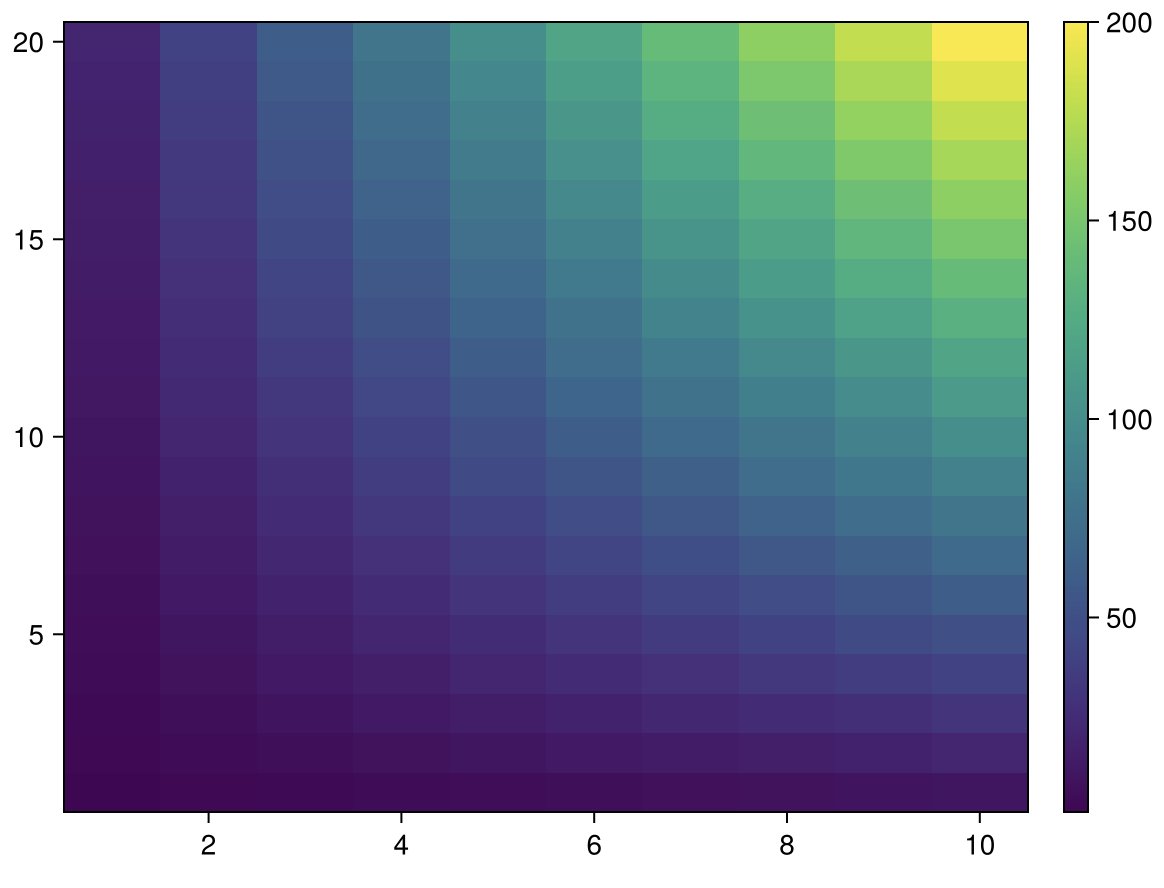
There is a default way to plot heatmaps which is fully supported but where you have to supply x, y and z as vectors. Admittedly, giving 2D data in this long format can sometimes be a bit cumbersome if you already have the interval, interval, matrix format instead.
In your case:
is = 1:10
js = 1:20
x = [i for i in is for j in js]
y = [j for i in is for j in js]
z = x .* y

mapping(x, y, z) * visual(Heatmap) |> draw