As far as I can see, the problem is not in the layout. What you have to do is this:
p = []instead ofp = empty()push!(p, plot(x, sin.(x)))instead ofappend!(p, plot(x, sin.(x)))
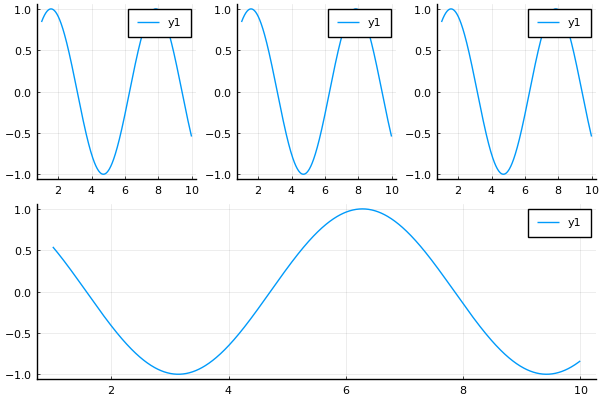
After these changes the code worked correctly and produced the following picture
Also the ‘standard’ way to define ranges is 1:Nplots, not range(1, Nplots).
Hope my answer was helpful