# Plot layout with parametrized number of rows/columns
**URL:** https://discourse.julialang.org/t/plot-layout-with-parametrized-number-of-rows-columns/100702
**Category:** Visualization
**Tags:** layout-plots
**Created:** [June 22, 2023, 1:44pm UTC](https://discourse.julialang.org/t/plot-layout-with-parametrized-number-of-rows-columns/100702 "2023-06-22T13:44:41Z")
**Posts on this page:** 6
**Page:** 1
### Author:  [@gvdeynde](https://discourse.julialang.org/u/gvdeynde)
#### Post date: [June 22, 2023, 1:44pm UTC](https://discourse.julialang.org/t/plot-layout-with-parametrized-number-of-rows-columns/100702/1 "2023-06-22T13:44:41Z")
Hi all
I would like to incrementally build a plot from different subplots using `layout`. The issue I’m struggling with is that the number of subplots is a parameter/variable. So I would like to build a list of subplots, then pass this on to `plot` with a certain layout that is built using `grid`. Code example (that doesn’t work but I don’t seem to figure out to get it working):
> Nplots = 3
> l = @layout [Plots.grid(1, Nplots); b]
>
> p = empty()
>
> x = range(1,10,1001)
>
> for i in range(1, Nplots)
> append!(p, plot(x, sin.(x)))
> end
>
> q = plot(x, cos.(x))
>
> plot(p…, q, layout = l)
What am I missing here? Is there a “standard” way to incrementally build up a plot from subplots where the number of subplots is variable?
---
### Author:  [@sijo](https://discourse.julialang.org/u/sijo)
#### Post date: [June 22, 2023, 3:35pm UTC](https://discourse.julialang.org/t/plot-layout-with-parametrized-number-of-rows-columns/100702/2 "2023-06-22T15:35:52Z")
Hi! Not sure about Plots.jl, but Makie.jl has a very nice layouting system, both flexible and powerful, and you can build the layout step by step.
The [layout tutorial](https://docs.makie.org/stable/tutorials/layout-tutorial/) will give you an idea of what can be done.
For your example a starting point could be:
```julia
using CairoMakie
Nplots = 3
x = range(1,10,1001)
fig = Figure(resolution=(1000, 300))
for i in 1:Nplots
lines(fig[1,i], x, sin.(x))
end
fig
```

and later you can do
```julia
lines(fig[1,end+1], x, cos.(x))
fig
```

and you can also append to the left or top:
```julia
lines(fig[begin-1, 3:4], x, tan.(x)) # this is fig[0, 3:4] :-)
fig
```

---
### Author:  [@gvdeynde](https://discourse.julialang.org/u/gvdeynde)
#### Post date: [June 22, 2023, 4:14pm UTC](https://discourse.julialang.org/t/plot-layout-with-parametrized-number-of-rows-columns/100702/3 "2023-06-22T16:14:48Z")
Thanks but I would like to avoid Makie for the moment simply because it uses Float32’s under the hood and I’ve run into multiple issues with precision loss (in log plots)…
---
### Author:  [@aryavorskiy](https://discourse.julialang.org/u/aryavorskiy)
#### Post date: [June 22, 2023, 6:22pm UTC](https://discourse.julialang.org/t/plot-layout-with-parametrized-number-of-rows-columns/100702/4 "2023-06-22T18:22:09Z")
As far as I can see, the problem is not in the layout. What you have to do is this:
- `p = []` instead of `p = empty()`
- `push!(p, plot(x, sin.(x)))` instead of `append!(p, plot(x, sin.(x)))`
After these changes the code worked correctly and produced the following picture
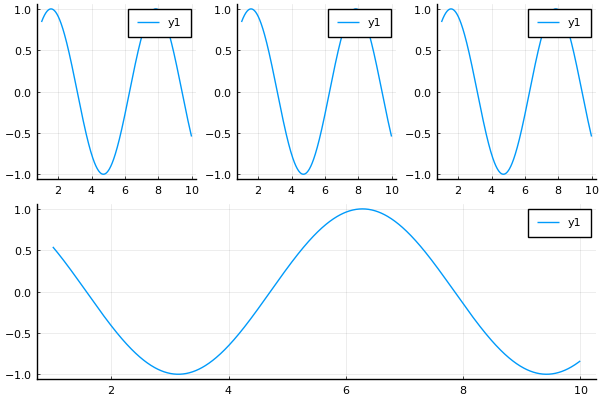
Also the ‘standard’ way to define ranges is `1:Nplots`, not `range(1, Nplots)`.
Hope my answer was helpful
---
### Author:  [@gvdeynde](https://discourse.julialang.org/u/gvdeynde)
#### Post date: [June 23, 2023, 6:42am UTC](https://discourse.julialang.org/t/plot-layout-with-parametrized-number-of-rows-columns/100702/5 "2023-06-23T06:42:52Z")
Thanks for the solution. Any insight on what the background of my mistakes is? `empty()` vs `[]` and `push!` vs `append!`? Just so I understand and not blindly copy/paste?
---
### Author:  [@sijo](https://discourse.julialang.org/u/sijo)
#### Post date: [June 23, 2023, 9:04am UTC](https://discourse.julialang.org/t/plot-layout-with-parametrized-number-of-rows-columns/100702/6 "2023-06-23T09:04:41Z")
I think you formatted the example code using a markdown quote instead of a code block, so the `empty` line shows a checkbox instead of `empty([])`. Then when we copy the code we get just `empty()`, which is not valid Julia.
Anyway `p = empty([])` is not wrong but a useless complication of `p = []` (writing `[]` already makes an empty vector, no need to make another one by calling `empty`.
We write `push!(x, yi)` to append one value `yi` to `x`, and `append!(x, y)` to append a collection of values. So `append!(p, plot(x, sin.(x)))` will take the result of `plot`, and take what is inside (a subplot) to append to the `p` vector. In the end you get a vector of subplots instead of a vector of plots.