Due to my low trust level I can’t edit the post so I am replying to my own question. The above problem can be trivially seen as a parametric surface plot. What I was looking for is the equivalent of Mathematica’s ParametricPlot3D function.
It is definitely doable using vanilla Plots package but the documentation is a bit lacking and it is definitely
not a one-liner. I stumbled onto the package
Axl that is supposedly doing what I want but I don’t want to turn my Julia installation into a package kitchen-sink.
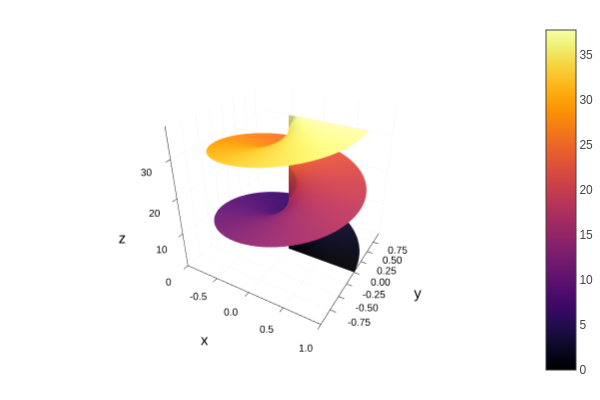
This is a minimal working example of the helicoid plot
#!/usr/bin/julia
using Debugger
using Plots;plotlyjs()

X(r,t) = r*cos(t)
Y(r,t) = r*sin(t)
Z(r,t) = 3*t

r_range = LinRange(0, 1, 200)
t_range = LinRange(0, 4*pi, 400)

x_grid = [X(r,t) for r in r_range, t in t_range]
y_grid = [Y(r,t) for r in r_range, t in t_range]
z_grid = [Z(r,t) for r in r_range, t in t_range]

plot(x_grid, y_grid, z_grid, st = :surface, xlabel = "x", ylabel = "y", zlabel = "z")
And the output