# My Pluto notebook is not Reactive
**URL:** https://discourse.julialang.org/t/my-pluto-notebook-is-not-reactive/97519
**Category:** New to Julia
**Created:** [April 15, 2023, 6:23pm UTC](https://discourse.julialang.org/t/my-pluto-notebook-is-not-reactive/97519 "2023-04-15T18:23:38Z")
**Posts on this page:** 5
**Page:** 1
### Author:  [@CBrauer](https://discourse.julialang.org/u/CBrauer)
#### Post date: [April 15, 2023, 6:23pm UTC](https://discourse.julialang.org/t/my-pluto-notebook-is-not-reactive/97519/1 "2023-04-15T18:23:39Z")
Hey Guys,
I tried my first attempt at a Pluto Notebook, and I have a concern.
But first, here is my environment:
1. I’m running on Windows 11, latest build (version 22H2)
2. Julia 1.8.5
3. Google Chrome
I have put the Notebook on my GitHub REPO at: [https://github.com/CBrauer/Pluto-Notebook/tree/main](https://github.com/CBrauer/Pluto-Notebook/tree/main)
Shown below is a plot that shows my concern. The data is X=50, Y=50, and the plot stops after 25. Why?

Any suggestion will be greatly appreciated.
Charles
---
### Author:  [@awasserman](https://discourse.julialang.org/u/awasserman)
#### Post date: [April 15, 2023, 6:47pm UTC](https://discourse.julialang.org/t/my-pluto-notebook-is-not-reactive/97519/2 "2023-04-15T18:47:47Z")
I find the same behavior, but I think the reason is simply that the constructed `X` vector has a maximum value of 25. You can see this by running `maximum(X)`.
The `size` function just tells you what are the dimensions of the array. So `size(X) == (50,)` indicates that `X` is a one-dimensional array with 50 elements.
To see if the “reactivity” of Pluto is working correctly, you can try modifying some prior cell defining X, Y, or the model, and see if the plot changes accordingly.
As a side note, you may want to take advantage of Pluto’s built-in [package environment manager](https://github.com/fonsp/Pluto.jl/wiki/%F0%9F%8E%81-Package-management). This would let you run the `using` commands without needing to import Pkg and install them. Note that when you import Pkg as done here, this will install the packages in your global environment. This may lead to difficulties down the line when you want to work with a different set of packages. You can see more about Julia’s package environment manager [here](https://docs.julialang.org/en/v1/manual/code-loading/#Environments-1) and [here](https://pkgdocs.julialang.org/v1/environments/).
---
### Author:  [@Charles\_Brauer](https://discourse.julialang.org/u/Charles_Brauer)
#### Post date: [April 17, 2023, 3:40am UTC](https://discourse.julialang.org/t/my-pluto-notebook-is-not-reactive/97519/3 "2023-04-17T03:40:39Z")
Thank you for your reply. I did as you suggested, and I printed out maximum(X). I got 50. It’s the number of rows in the “cars” dataset.
The plot only shows a range of about 25. This is very discouraging.
---
### Author:  [@mkitti](https://discourse.julialang.org/u/mkitti)
#### Post date: [April 17, 2023, 5:48am UTC](https://discourse.julialang.org/t/my-pluto-notebook-is-not-reactive/97519/4 "2023-04-17T05:48:44Z")
Note that you can manipulate the limits of the plot via [`xlims!`](https://docs.juliaplots.org/latest/api/#Plots.xlims!-Tuple%7BTuple%7D).
> [@Charles\_Brauer](#):
>
> Thank you for your reply. I did as you suggested, and I printed out maximum(X). I got 50. It’s the number of rows in the “cars” dataset.
Assuming that we are talking about the `cars` dataset from the RDatasets.jl package, I notice that the maximum value of `cars.Speed`, which I think is your `X`, is indeed `25`.
```julia
julia> using Plots, RDatasets
julia> cars = dataset("datasets", "cars");
julia> X = cars.Speed; Y = cars.Dist;
julia> maximum(X)
25
plot(cars.Speed, cars.Dist, seriestype=:scatter)
```

Another way of doing this would be to use StatsPlots.jl:
```julia
julia> using StatsPlots
julia> @df cars scatter(:Speed, :Dist)
```
After looking at your notebook, I believe that `X` and `Y` are in fact `Speed` and `Dist`.
[https://github.com/CBrauer/Pluto-Notebook/blob/a8bfad434f46541a48c07657568d96df4af0b8d0/SmoothingSplineNotebook.jl#L30-L31](https://github.com/CBrauer/Pluto-Notebook/blob/a8bfad434f46541a48c07657568d96df4af0b8d0/SmoothingSplineNotebook.jl#L30-L31)
Now if you just want to plot `X` and `Y` against the numbers 1 through 50, you coul do the following.
```julia
julia> begin
plot(Y, seriestype=:scatter, label="Y");
plot!(X, seriestype=:scatter, label="X");
end
```
The above would yield the following which goes out to 50.
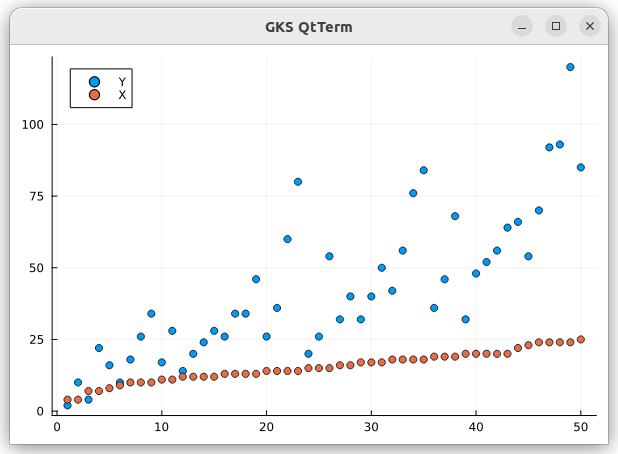
You could achieve the same plot by explicitly providing `1:50`.
```julia
julia> begin
plot(1:50, Y, seriestype=:scatter, label="Y");
plot!(1:50, X, seriestype=:scatter, label="X");
end
```
Better yet, you could extract the row numbers directly rather than hard coding thme.
```julia
julia> begin
rownumbers = parentindices(cars)[1]
plot(rownumbers, Y, seriestype=:scatter, label="Y");
plot!(rownumbers, X, seriestype=:scatter, label="X");
end
```
I’m not sure exactly where the point of confusion is, but I’ll try to summarize.
1. You are plotting `Dist` versus `Speed`.
2. `maximum(cars.Speed)` is `25`. Thus the plot only extends to `25`.
3. If you want to plot `Dist` and `Speed` versus their `Row` number, you can do this by plotting each as their own series. This works by either omitting the x-coordinate values, explicitly hard coding them, or gleaning them from the data frame.
---
### Author:  [@Charles\_Brauer](https://discourse.julialang.org/u/Charles_Brauer)
#### Post date: [April 17, 2023, 2:23pm UTC](https://discourse.julialang.org/t/my-pluto-notebook-is-not-reactive/97519/5 "2023-04-17T14:23:03Z")
Thank you for your excellent explanation. I get it now!