# Makie: Colorbar with the "High" and "Low" labels
**URL:** https://discourse.julialang.org/t/makie-colorbar-with-the-high-and-low-labels/101604
**Category:** Visualization
**Tags:** makie, colorbar
**Created:** [July 14, 2023, 5:23am UTC](https://discourse.julialang.org/t/makie-colorbar-with-the-high-and-low-labels/101604 "2023-07-14T05:23:24Z")
**Posts on this page:** 3
**Page:** 1
### Author:  [@nari](https://discourse.julialang.org/u/nari)
#### Post date: [July 14, 2023, 5:23am UTC](https://discourse.julialang.org/t/makie-colorbar-with-the-high-and-low-labels/101604/1 "2023-07-14T05:23:24Z")
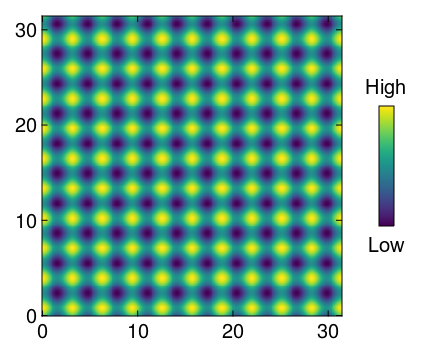
When accompanying a heatmap with a color bar, the values at both ends themselves have no physical meaning, only the type and which direction they are used in are sometimes important. In that case, I would prepare a color bar like the following.
Currently, the size of the color bar, the coordinates to place the label and the font size are entered manually. Any comments on documentation or code I should read in order to specify some of these parameters and have the rest automatically optimized for position and size would be appreciated.
```julia
using CairoMakie
begin
fig = Figure()
ax = CairoMakie.Axis(fig[1,1], height=300, width=300)
heatmap!(0:0.1:10π, 0:0.1:10π, [cos(x)+sin(y) for x in 0:0.2:20π, y in 0:0.2:20π],colormap=:viridis)
ax1 = CairoMakie.Axis(fig[1,2], limits=(0,1,0,1),height=180, width=40)
hidedecorations!(ax1)
hidespines!(ax1)
Colorbar(fig[1,2], colormap=:viridis, colorrange=(0,1),vertical = true, height=120, width=15, halign=:center, valign=:center,flipaxis = true, labelsize=20, labelpadding=10, ticksvisible=false, ticklabelsvisible=false)
text!(ax1, 0.5,1.0, text="High", fontsize=20, align=(:center,:top))
text!(ax1, 0.5,0.0, text="Low", fontsize=20, align=(:center,:bottom))
resize_to_layout!(fig)
display(fig)
end
```
---
### Author:  [@jules](https://discourse.julialang.org/u/jules)
#### Post date: [July 14, 2023, 9:40am UTC](https://discourse.julialang.org/t/makie-colorbar-with-the-high-and-low-labels/101604/2 "2023-07-14T09:40:10Z")
A slightly easier way is to use a subgrid and place two labels and the colorbar in there.
```julia
begin
fig = Figure()
ax = Axis(fig[1,1], height=300, width=300)
heatmap!(0:0.1:10π, 0:0.1:10π, [cos(x)+sin(y) for x in 0:0.2:20π, y in 0:0.2:20π],colormap=:viridis)
subgrid = GridLayout(fig[1, 2], tellheight = false)
Label(subgrid[1, 1], "High")
Colorbar(subgrid[2, 1], colormap=:viridis, colorrange=(0,1),vertical = true, height=120, width=15, halign=:center, valign=:center,flipaxis = true, labelsize=20, labelpadding=10, ticksvisible=false, ticklabelsvisible=false)
Label(subgrid[3, 1], "Low")
rowgap!(subgrid, 5)
resize_to_layout!(fig)
fig
end
```

If you don’t constrain the colorbar height the labels will then match the edges of the axis, which can be nice.

---
### Author:  [@nari](https://discourse.julialang.org/u/nari)
#### Post date: [July 18, 2023, 12:31am UTC](https://discourse.julialang.org/t/makie-colorbar-with-the-high-and-low-labels/101604/3 "2023-07-18T00:31:56Z")
Amazing, thank you.