# How to scale the density of violin plot
**URL:** https://discourse.julialang.org/t/how-to-scale-the-density-of-violin-plot/104737
**Category:** General Usage
**Tags:** question, plotting, statsplots
**Created:** [October 8, 2023, 9:12pm UTC](https://discourse.julialang.org/t/how-to-scale-the-density-of-violin-plot/104737 "2023-10-08T21:12:04Z")
**Posts on this page:** 3
**Page:** 1
### Author:  [@Christopher\_Fisher](https://discourse.julialang.org/u/Christopher_Fisher)
#### Post date: [October 8, 2023, 9:12pm UTC](https://discourse.julialang.org/t/how-to-scale-the-density-of-violin-plot/104737/1 "2023-10-08T21:12:04Z")
I would like to use a violin plot to display density information. For the x-axis, the scaling matters. However, only the shape of the densities matter. How can I rescale the densities to prevent occlusion?
Here is a simple example:
```julia
using StatsPlots
violin(repeat([.1,.2,.3],outer=100),randn(300), side=:right)
```
Thanks!
---
### Author:  [@jd-foster](https://discourse.julialang.org/u/jd-foster)
#### Post date: [October 9, 2023, 2:36am UTC](https://discourse.julialang.org/t/how-to-scale-the-density-of-violin-plot/104737/2 "2023-10-09T02:36:17Z")
It seems to help to use `groupedviolin` instead
```julia
groupedviolin(repeat([.1,.2,.3],outer=100),randn(300), side=:right, fillalpha=0.25)
```
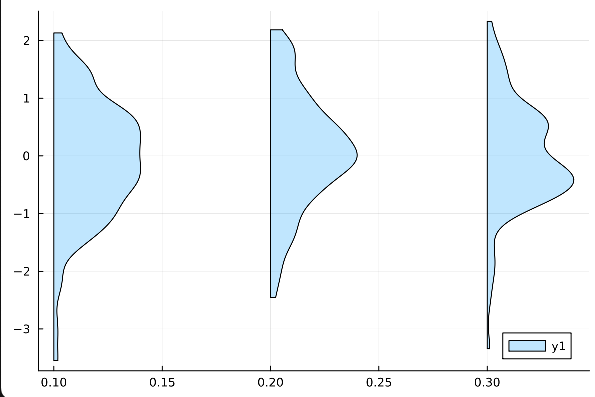
Code here: [https://github.com/JuliaPlots/StatsPlots.jl/blob/d63908437088d74bc7daa32f4915e51f3c25fa11/src/violin.jl#L180](https://github.com/JuliaPlots/StatsPlots.jl/blob/d63908437088d74bc7daa32f4915e51f3c25fa11/src/violin.jl#L180)
---
### Author:  [@Christopher\_Fisher](https://discourse.julialang.org/u/Christopher_Fisher)
#### Post date: [October 9, 2023, 11:06am UTC](https://discourse.julialang.org/t/how-to-scale-the-density-of-violin-plot/104737/3 "2023-10-09T11:06:58Z")
Thank you. That does help quite a bit in many cases. It does break down when the spacing is variable:
`groupedviolin(repeat([.1,.15,.5],outer=100),randn(3000)*.1, side=:right, fillalpha=0.25)`
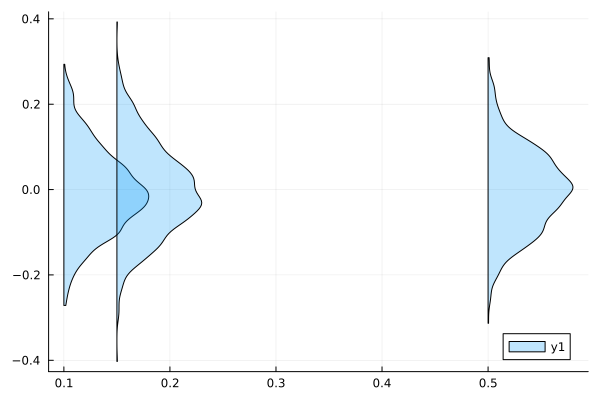
I noticed the keyword `spacing` in the linked function, but it did not seem to have an effect on the space.
Somewhat related question: is it possible to use fillalpha between quantiles, such as at .025 and .975?