# How to color points in scatter plot by value?
**URL:** https://discourse.julialang.org/t/how-to-color-points-in-scatter-plot-by-value/11740
**Category:** General Usage
**Tags:** plotting
**Created:** [June 17, 2018, 11:03pm UTC](https://discourse.julialang.org/t/how-to-color-points-in-scatter-plot-by-value/11740 "2018-06-17T23:03:16Z")
**Posts on this page:** 4
**Page:** 2
### Author:  [@MichaelGao](https://discourse.julialang.org/u/MichaelGao)
#### Post date: [September 18, 2022, 7:35am UTC](https://discourse.julialang.org/t/how-to-color-points-in-scatter-plot-by-value/11740/21 "2022-09-18T07:35:06Z")
> [@VivMendes](#):
>
> Interestingly, the piece of code that @kristoffer.carlsson provided above can easily render a 3D scatter which is capable of displaying 4 dimensions by using color.
Impressive!
How should I add lines between points in a plot like this?
Can this be done with PGFPlotsX?

---
### Author:  [@alex-s-gardner](https://discourse.julialang.org/u/alex-s-gardner)
#### Post date: [December 19, 2022, 6:05pm UTC](https://discourse.julialang.org/t/how-to-color-points-in-scatter-plot-by-value/11740/22 "2022-12-19T18:05:36Z")
This can also be done using Makie.jl:
> [@Makie recipe for creating a scatter plot with points colored by value](https://discourse.julialang.org/t/makie-recipe-for-creating-a-scatter-plot-with-points-colored-by-value/91754/5):
>
> This is much easier than I had thought, for anyone that comes next here is the recipe (See Makie docs has a more [generic scatter example](https://docs.makie.org/stable/examples/plotting_functions/scatter/#using_points) and examples for [colored lines](https://beautiful.makie.org/dev/examples/generated/2d/lines/line_cmaps/): using CairoMakie # create synthetic data n = 1000; x = 1:n; y = sin.(collect(x) .\* .05); z = vcat(1:n/2, n/2:-1:1) .- n/4 # set color axis limits which by default is automatically equal to the extrema of the color values colorrange = [-n/4, n/4]; # choose color map [https://docs.juliahub…
---
### Author:  [@Fourier](https://discourse.julialang.org/u/Fourier)
#### Post date: [November 2, 2025, 3:11pm UTC](https://discourse.julialang.org/t/how-to-color-points-in-scatter-plot-by-value/11740/23 "2025-11-02T15:11:41Z")
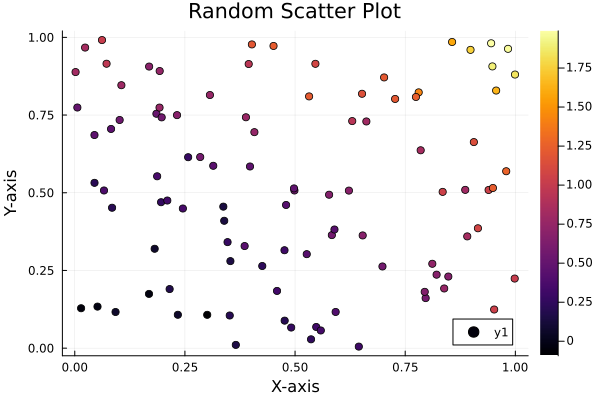
Because I havent seen that solution here. I just do it like this:
```julia-auto
using Plots
x = rand(100)
y = rand(100)
z = x.^2 + y.^2 + 0.1randn(100)
scatter(x, y, zcolor=z)
savefig("scatter_plot.png")
```
---
### Author:  [@rafael.guerra](https://discourse.julialang.org/u/rafael.guerra)
#### Post date: [November 2, 2025, 4:26pm UTC](https://discourse.julialang.org/t/how-to-color-points-in-scatter-plot-by-value/11740/24 "2025-11-02T16:26:24Z")
> [@Fourier](#):
>
> `zcolor=z`
For your information, `zcolor` is one of the aliases for the `marker_z` attribute (see Plots.jl [series attributes](https://docs.juliaplots.org/dev/generated/attributes_series/)). So, this is the same as the [post above](https://discourse.julialang.org/t/how-to-color-points-in-scatter-plot-by-value/11740/10).
[Previous page](https://discourse.julialang.org/t/how-to-color-points-in-scatter-plot-by-value/11740.md?page=1)