# Heatmap! in GeoMakie
**URL:** https://discourse.julialang.org/t/heatmap-in-geomakie/133249
**Category:** Geo
**Tags:** plotting, geomakie
**Created:** [October 17, 2025, 8:07pm UTC](https://discourse.julialang.org/t/heatmap-in-geomakie/133249 "2025-10-17T20:07:48Z")
**Posts on this page:** 4
**Page:** 1
### Author:  [@mreichMPI-BGC](https://discourse.julialang.org/u/mreichMPI-BGC)
#### Post date: [October 17, 2025, 8:07pm UTC](https://discourse.julialang.org/t/heatmap-in-geomakie/133249/1 "2025-10-17T20:07:48Z")
The projection in heatmap! does not seem to work (using GeoMAkie 0.7.15), the example
```julia-auto
using GeoMakie, GLMakie
lons = -180:180
lats = -90:90
field = [exp(cosd(l)) + 3(y/90) for l in lons, y in lats]
fig = Figure()
ax = GeoAxis(fig[1,1])
#sp = surface!(ax, lons, lats, field; shading = NoShading) #(works)
sp = heatmap!(ax, lons, lats, field)
fig
```
gives
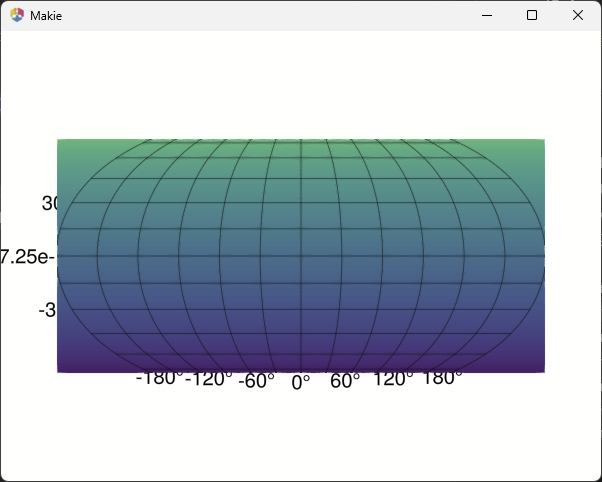
Also for a global lat lon Raster is does not work (the real world case). surface works, but with surface I cannot well overplot country border because they stay behind.
Any suggestion appreciated!
---
### Author:  [@asinghvi17](https://discourse.julialang.org/u/asinghvi17)
#### Post date: [October 17, 2025, 8:29pm UTC](https://discourse.julialang.org/t/heatmap-in-geomakie/133249/2 "2025-10-17T20:29:47Z")
Heatmap will probably only work in CairoMakie. If you have regularly sampled lat/long ranges, you can use the `meshimage` recipe from GeoMakie, which is equivalent to heatmap but specialized for nonlinear transformations. If not, then surface would be your best bet.
There are two ways to make a surface able to be plotted over.
1. You can provide it a grid of zeros as the `z` argument and provide the actual data to the `color` kwarg, like so: `sp = surface!(ax, lons, lats, zeros(size(field)); color = field, shading = NoShading) `
2. You can translate it back by `translate!(surface_plot, 0, 0, -maximum(surface_z))`,
Either way should work. Otherwise you can also translate the plots you want in front of it forward, so `translate!(your_other_plot, 0, 0, max(surface_z) + 10)` for example
---
### Author:  [@mreichMPI-BGC](https://discourse.julialang.org/u/mreichMPI-BGC)
#### Post date: [October 18, 2025, 10:02am UTC](https://discourse.julialang.org/t/heatmap-in-geomakie/133249/3 "2025-10-18T10:02:49Z")
Thanks! - With a Raster the `translate!` “trick” certainly is most handy.
FWIW a brief real world example:
```julia-auto
using Rasters, RasterDataSources, GeoMakie, Makie, ColorSchemes, NaturalEarth
elev = getraster(WorldClim{Elevation}) |> x -> Raster(x.elev)
fig=Figure(size=(1000,600))
ga=GeoAxis(fig[1,1], dest="+proj=eqearth", xticklabelsvisible=false, yticklabelsvisible=false, xticks=[-180, 180], yticks=[-90,90], title="Elevation (m)")
sp = GeoMakie.surface!(ga, elev, shading=false, colormap=:terrain, colorscale=Makie.LogScale(0.001, 10))
Colorbar(fig[2,1], sp; label="[m asl.]", width=800, vertical=false)
lines!(ga, GeoMakie.coastlines(), color=:black, linewidth=0.5)
countries = NaturalEarth.naturalearth("admin_0_countries", 110)
poly!(ga, countries.geometry, color=:transparent, strokecolor=:black, strokewidth=0.5)
translate!(sp, 0,0, -maximum(elev |> skipmissing))
fig
```

---
### Author:  [@asinghvi17](https://discourse.julialang.org/u/asinghvi17)
#### Post date: [October 18, 2025, 1:32pm UTC](https://discourse.julialang.org/t/heatmap-in-geomakie/133249/4 "2025-10-18T13:32:02Z")
Awesome! Looks like a pretty cool plot 😉