# Custom color palette (including associated value range)
**URL:** https://discourse.julialang.org/t/custom-color-palette-including-associated-value-range/131949
**Category:** Visualization
**Tags:** question, plotting, plots, colour
**Created:** [August 29, 2025, 7:38pm UTC](https://discourse.julialang.org/t/custom-color-palette-including-associated-value-range/131949 "2025-08-29T19:38:09Z")
**Posts on this page:** 4
**Page:** 1
### Author:  [@sylvaticus](https://discourse.julialang.org/u/sylvaticus)
#### Post date: [August 29, 2025, 7:38pm UTC](https://discourse.julialang.org/t/custom-color-palette-including-associated-value-range/131949/1 "2025-08-29T19:38:09Z")
I am looking to how create a custom “legend” for my plots where I associate given colours to custom ranges, for example:
```julia-auto
0:0.5 => darkdarkred
0.0:0.75 => darkred
0.75:1 => red
1:1.25 => green
1.25:1.5 => darkgreen
1:5:2 => darkdarkgreen
```
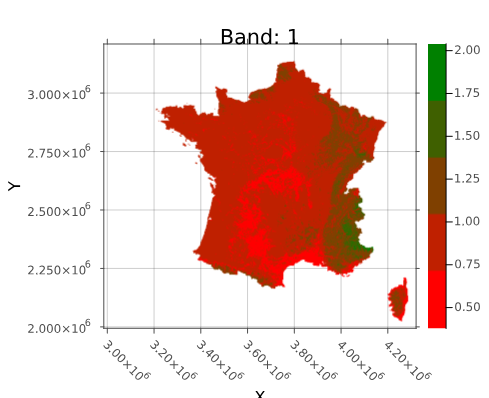
I need it co compare different plots where I want the association value =\> colour to remain stable, like here (obtained with `plot(myraster, c = palette([:red, :green], 5))` ) :
---
### Author:  [@empet](https://discourse.julialang.org/u/empet)
#### Post date: [August 31, 2025, 7:36pm UTC](https://discourse.julialang.org/t/custom-color-palette-including-associated-value-range/131949/2 "2025-08-31T19:36:24Z")
To map values from a subinterval to the same color, you must give the vector of boundary values for subintervals of an interval [a,b].
For your example `boundary_vals = [0, 0.5, 0.75, 1, 1.25, 1.5, 2]`. These vals define `length(boundary_vals)-1` subintervals. Hence we need a vector, `mycolors`, of `n= length(boundary_vals)-1` colors. The function `constant_color` returns the knots in the normalized global interval ([0,2] here), and the vector of repeating colors at the end of its subintervals, to get through interpolation a constant color between two consecutive knots.
```julia-auto
using Colors, FixedPointNumbers, Interpolations, Plots
function constant_color(boundary_vals:: Vector{Float64}, mycolors::Vector{RGB{N0f8}})
if length(boundary_vals) != length(mycolors)+1
error("length of boundary values should be equal to length(mycolors)+1")
end
bvals = sort(boundary_vals)
nvals = [(v-bvals[1])/(bvals[end]-bvals[1]) for v in bvals] #normalized values
knts = Float64[]
colorv = RGB{N0f8}[]
for k in 1:length(mycolors)
append!(knts, [nvals[k], nvals[k+1]])
append!(colorv, [mycolors[k], mycolors[k]])
end
knts, colorv
end
boundary_vals = [0, 0.5, 0.75, 1, 1.25, 1.5, 2]
#hexc = ["#8B0000", "#C6011F", "#FF0000", "#32CD32", "#009000", "#00674b"]
#mycolors = [parse(RGB{N0f8}, h) for h in hexc]
mycolors = [RGB{N0f8}(0.545,0.0,0.0), RGB{N0f8}(0.776,0.004,0.122), RGB{N0f8}(1.0,0.0,0.0),
RGB{N0f8}(0.196,0.804,0.196), RGB{N0f8}(0.0,0.565,0.0), RGB{N0f8}(0.0,0.404,0.294)]
knts, colorv = constant_color(boundary_vals, mycolors)
println(knts, "\n\n", colorv)
vals = Interpolations.deduplicate_knots!(knts)
r = [red(c) for c in colorv]
g = [green(c) for c in colorv]
b = [blue(c) for c in colorv]
itp_r = interpolate((vals,), r, Gridded(Constant()))
itp_g = interpolate((vals,), g, Gridded(Constant()))
itp_b = interpolate((vals,), b, Gridded(Constant()))
scale = range(0, 1, length=255)
interp_colors = [RGB{N0f8}(itp_r(s), itp_g(s), itp_b(s)) for s in scale]
#Example
vh = reshape(2*rand(49), 7, 7) #rnd matrix with elements in [0,2]
vh[1, 5] = 0 #ensure that the ends of the interval, [0, 2], appear in the matrix vh,
vh[4, 2] = 2 #to get a colorbar that displays the boundary_vals
heatmap(vh, color=interp_colors, size=(375, 350))
```
---
### Author:  [@joa-quim](https://discourse.julialang.org/u/joa-quim)
#### Post date: [August 31, 2025, 7:44pm UTC](https://discourse.julialang.org/t/custom-color-palette-including-associated-value-range/131949/3 "2025-08-31T19:44:43Z")
Like in?
> **[17. Of Colors and Color Legends — GMT 6.7.0 documentation](https://docs.generic-mapping-tools.org/dev/reference/cpts.html#labeled-and-non-equidistant-color-legends)**
EDIT: Sorry, better link.
> **[Color maps](https://www.generic-mapping-tools.org/GMTjl_doc/examples/CPTs/01_cpt_hinge/#example_1336622456775633275)**
---
### Author:  [@rafael.guerra](https://discourse.julialang.org/u/rafael.guerra)
#### Post date: [August 31, 2025, 8:37pm UTC](https://discourse.julialang.org/t/custom-color-palette-including-associated-value-range/131949/4 "2025-08-31T20:37:27Z")
In Plots.jl, this is how I would do it:
```julia-auto
using Plots; gr(dpi=1200)
n = range(0, pi, 200)
x = 2 * abs.(sin.(n .* n'))
colors = [RGB(0.3, 0.0, 0.0) , :darkred, :red, :green, :darkgreen, RGB(0.0, 0.2, 0.0)]
ranges = [0.5, 0.75, 1.0, 1.25, 1.50] / 2 # normalized over [0, 1]
cg = cgrad(colors, ranges, categorical=true)
heatmap(x, color=cg, clim=(0, 2))
```

**NOTE:**
More generally, to handle arbitrary ranges of input data, simply define a linear mapping from your colorbar data range to the [0, 1] interval of the cgrad() function. For your example, the linear mapping was simple division by two.