# Building a Julia-Powered E-Ink Dashboard: A Dev Log
**URL:** https://discourse.julialang.org/t/building-a-julia-powered-e-ink-dashboard-a-dev-log/130709
**Category:** General Usage
**Tags:** development, raspberry-pi, project, maker
**Created:** [July 14, 2025, 4:28pm UTC](https://discourse.julialang.org/t/building-a-julia-powered-e-ink-dashboard-a-dev-log/130709 "2025-07-14T16:28:08Z")
**Posts on this page:** 17
**Page:** 1
### Author:  [@TheCedarPrince](https://discourse.julialang.org/u/TheCedarPrince)
#### Post date: [July 14, 2025, 4:28pm UTC](https://discourse.julialang.org/t/building-a-julia-powered-e-ink-dashboard-a-dev-log/130709/1 "2025-07-14T16:28:08Z")
> Every great journey starts with a single step. 🧙♂️
In the spirit of open source, adventure, and fun, I am making an on-going development log here about building a Julia-powered e-ink dashboard ran on a Raspberry Pi. This was sparked off by the apparent interest folks had for my original post:
> [@Help Me Drive an E-Ink Display on a Raspberry Pi Using Julia!](https://discourse.julialang.org/t/help-me-drive-an-e-ink-display-on-a-raspberry-pi-using-julia/123972/18):
>
> Update: Images Working framed_picture It took a weekend of tinkering off and on, but I finally have image displaying working using WiringPi.jl! I had to go back to the original library from WaveShare to figure out how to prepare images. As it would turn out, I had to reimplement some of the dithering abilities from the [PIL Python library](https://pillow.readthedocs.io/en/stable/) and do a bunch of byte-packing based on @stene 's suggestion. I got a little prototype working and now we shall do some cleaning and package prepa…
As I continue pressing along with this small hobby project, I invite you to tag along as I go on many side-quests, (mis)adventures, and more in this little project! Who knows what we’ll end up making?
~ tcp 🌳
---
### Author:  [@TheCedarPrince](https://discourse.julialang.org/u/TheCedarPrince)
#### Post date: [July 14, 2025, 4:30pm UTC](https://discourse.julialang.org/t/building-a-julia-powered-e-ink-dashboard-a-dev-log/130709/2 "2025-07-14T16:30:45Z")
**Log 01: Undated Sketches**
Up until now, I went on a small side-quest to explore weather APIs. A component that I want to make for my dashboard is a weather component to check things like:
- UV Index ☀
- Temperature 🌡
- Humidity 🥵
- Precipitation & Amount 🌧
- Wind speed & Direction 🍃
- Sunset & Sunrise 🌒
- Air Quality Index 🌸
To this end, I found [OpenMeteo](https://open-meteo.com)! I had found [GitHub - vnegi10/WeatherReport.jl: A simple weather app for the Julia REPL](https://github.com/vnegi10/WeatherReport.jl) by @vnegi10 which looked promising but found it’s priority wasn’t to give data from the website but have a nice REPL output of weather. Very cool!
Reading some discussions on issues by Vikas, I found that [OpenMeteo had an OpenAPI.yaml spec](https://github.com/open-meteo/open-meteo/blob/main/openapi.yml). Promising! Played with that using OpenAPI.jl but ultimately found that it was extremely limited – they are still in the process of supporting it. So, hit a bit of a wall.
But then! I discovered a strange thing called a flatbuffer spec they use. Turns out `flatc` can generate a variety of language bindings for an API wrapper package using this spec. And of course, Julia was not supported – [until I found an old fork of `flatbuffers`](https://github.com/jonalm/flatbuffers) by @jonalm that purportedly supported Julia. I knew [it worked once upon a time](https://github.com/JuliaData/FlatBuffers.jl/issues/61) thanks to confirmation by @evetion. Buoyed by this promising end to create Julia bindings for OpenMeteo’s flatbuffer spec, I went ahead, cloned it, ran `cmake` and ran the `make` pipeline.
It failed.
BUT I WOULD NOT CONCEDE DEFEAT! Using a combination of C++ programming skills I had from years ago and help from ChatGPT, I quickly monkey-patched the fork. And – pow! – I generated Julia bindings for OpenMeteo using the spec!
Now, I am in the process of making a little Julia OpenMeteo package that builds on top of these bindings with direct inspiration from [OpenMeteo’s python-requests package](https://github.com/open-meteo/python-requests).
Do I know what I am doing? Not entirely. Am I motivated? Mostly. Do I want weather data? You betcha.
Stay tuned!
---
### Author:  [@TheCedarPrince](https://discourse.julialang.org/u/TheCedarPrince)
#### Post date: [July 14, 2025, 5:25pm UTC](https://discourse.julialang.org/t/building-a-julia-powered-e-ink-dashboard-a-dev-log/130709/3 "2025-07-14T17:25:40Z")
**Log 02: July 13th, 2025 - Weather Imagineering**
After tinkering further with OpenMeteo, I decided to take a break and determine what data I want exactly. I concluded that basically, this is the information I want from the Weather Forecast API:
**Location**
- `latitude=42.3751`
- `longitude=-71.1056`
**Daily Variables Requested**
- `temperature_2m_max`: Daily maximum temperature at 2 meters
- `temperature_2m_min`: Daily minimum temperature at 2 meters
- `sunset`: Time of sunset
- `sunrise`: Time of sunrise
- `wind_speed_10m_max`: Maximum wind speed at 10 meters
- `wind_gusts_10m_max`: Maximum wind gusts at 10 meters
- `wind_speed_10m_min`: Minimum wind speed at 10 meters
- `wind_gusts_10m_min`: Minimum wind gusts at 10 meters
**Hourly Variables Requested**
- `temperature_2m`: Temperature at 2 meters
- `uv_index`: UV index
- `precipitation_probability`: Probability of precipitation
- `precipitation`: Amount of precipitation
- `relative_humidity_2m`: Relative humidity at 2 meters
- `wind_speed_10m`: Wind speed at 10 meters
- `wind_direction_10m`: Wind direction at 10 meters
**Other Options**
- `timezone=America/New_York`: Output times in the Eastern Time zone (encoded as `%2F`)
- `forecast_days=3`: Request a 3-day forecast
- `timeformat=unixtime`: Timestamps in Unix time format (seconds since epoch)
- `wind_speed_unit=mph`: Wind speeds in miles per hour
- `temperature_unit=fahrenheit`: Temperatures in Fahrenheit
- `precipitation_unit=inch`: Precipitation in inches
**Curl Request Example:**
```sh
curl https://api.open-meteo.com/v1/forecast?latitude=42.3751&longitude=-71.1056&daily=temperature_2m_max,temperature_2m_min,sunset,sunrise,wind_speed_10m_max,wind_gusts_10m_max,wind_speed_10m_min,wind_gusts_10m_min&hourly=temperature_2m,uv_index,precipitation_probability,precipitation,relative_humidity_2m,wind_speed_10m,wind_direction_10m&timezone=America%2FNew_York&forecast_days=3&timeformat=unixtime&wind_speed_unit=mph&temperature_unit=fahrenheit&precipitation_unit=inch
```
And Air Quality API:
**Hourly Variables Requested**
- `us_aqi`: U.S. Air Quality Index (based on EPA standards)
**Other Options**
- `forecast_days=3`: Request a 3-day forecast
**Curl Request Example:**
```sh
curl https://air-quality-api.open-meteo.com/v1/air-quality?latitude=52.52&longitude=13.41&hourly=us_aqi&forecast_days=3
```
* * *
From there, I began tinkering with how to display this data on my display. I sketched out a small draft of this here:

Basically, I am imagining using Makie.jl and a PolarAxis radial chart to display this information (thanks to @asinghvi17 and @sdanisch for the tips here):
> You can make multiple polar axes and use [PolarAxis | Makie](https://docs.makie.org/dev/reference/blocks/polaraxis#Radial-Offset)
In my designing, I found this [example to be beautiful](https://observablehq.com/@analyzer2004/west-coast-weather-from-seattle-to-san-diego) and something I could base my work off of:

I also found [this other example](https://www.informationisbeautifulawards.com/showcase/4231-does-size-matter) which was also hugely inspiring:
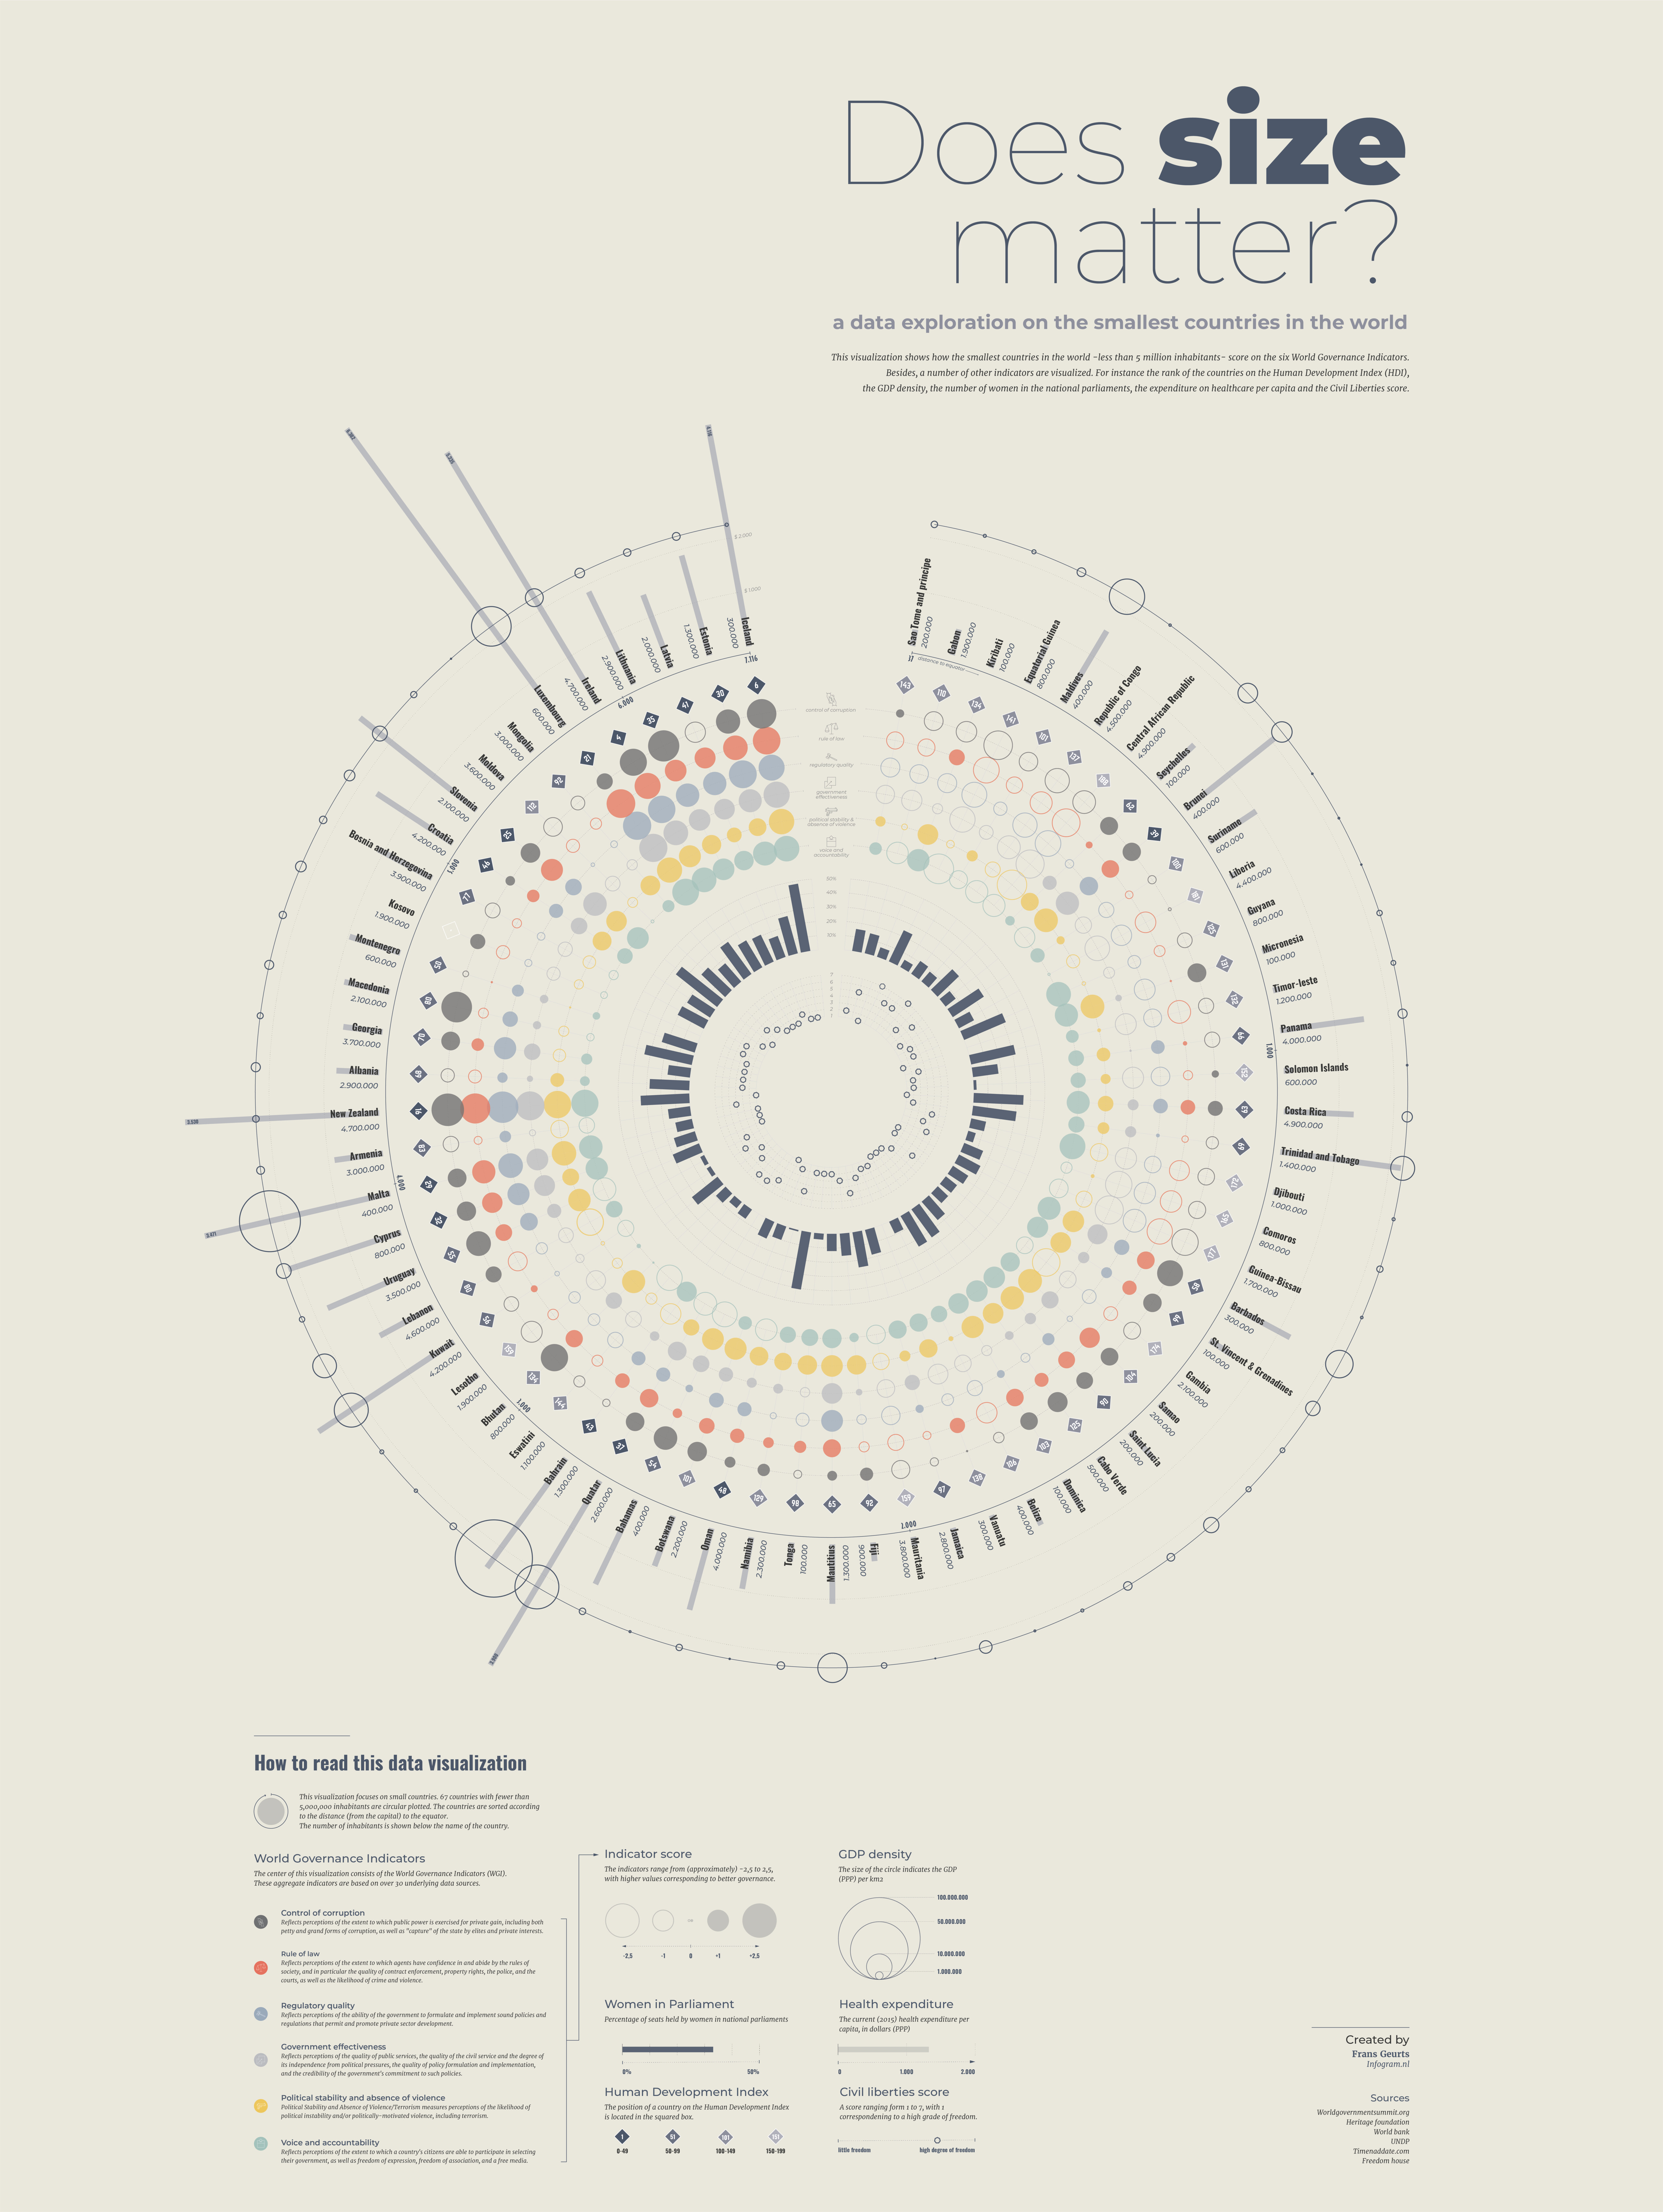
This will be a task for future TCP.
* * *
Finally, I decided to put some thoughts to code and began drafting a Jinkies.jl framework for how to “chunk” the regions of an e-ink display. As of now, I have two structs called `Display` and another called `Component`. `Display` holds information about the e-ink display and what components are in the display. A `Component` holds plotting information about what goes into the display and where.
I am imagining making `Component`’s more like an interface too so I can make any component that could be rendered to an image using tools like Makie, Luxor, and more.
Currently, I have made a PrettyTables.jl interface to represent an e-ink display’s pixels in a coarser granularity than pixel dimensions. Here’s how things look so far:
```julia-repl
julia> Jinkies.set_display_grid!(100, 120)
E-Ink Display Grid
┌─────┬─────┬─────┬─────┬─────┬─────┬─────┬─────┬─────┐
│ │ 001 │ 002 │ 003 │ 004 │ 005 │ 006 │ 007 │ 008 │
├─────┼─────┼─────┼─────┼─────┼─────┼─────┼─────┼─────┤
│ 1 │ ⬤ │ ⬤ │ ⬤ │ ⬤ │ ⬤ │ ⬤ │ ⬤ │ ⬤ │
├─────┼─────┼─────┼─────┼─────┼─────┼─────┼─────┼─────┤
│ 2 │ ⬤ │ ⬤ │ ⬤ │ ⬤ │ ⬤ │ ⬤ │ ⬤ │ ⬤ │
├─────┼─────┼─────┼─────┼─────┼─────┼─────┼─────┼─────┤
│ 3 │ ⬤ │ ⬤ │ ⬤ │ ⬤ │ ⬤ │ ⬤ │ ⬤ │ ⬤ │
├─────┼─────┼─────┼─────┼─────┼─────┼─────┼─────┼─────┤
│ 4 │ ⬤ │ ⬤ │ ⬤ │ ⬤ │ ⬤ │ ⬤ │ ⬤ │ ⬤ │
└─────┴─────┴─────┴─────┴─────┴─────┴─────┴─────┴─────┘
```
And then for colors, I can do something like this to say where a part of an e-ink display already has a component:
```julia-repl
julia> Jinkies._update_display_grid_colors!(
[[1,1], [1,2],[2,1],[2,2]]
)
```
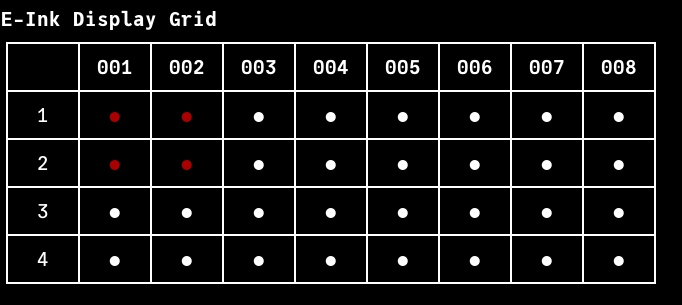
I like the display representation so far, but I need to mess around a bit further with the component and display interplay. Also encoding what information should be stored here and there.
* * *
And that is where we shall leave the dev log for now. Nice day of exploring, hacking, and imagineering! Onwards!
---
### Author:  [@GeorgeGkountouras](https://discourse.julialang.org/u/GeorgeGkountouras)
#### Post date: [July 15, 2025, 9:47pm UTC](https://discourse.julialang.org/t/building-a-julia-powered-e-ink-dashboard-a-dev-log/130709/4 "2025-07-15T21:47:22Z")
> [@TheCedarPrince](#):
>
> - Precipitation & Amount 🌧
>
> […] a nice REPL output of weather.
Should that be an output only? Let’s invoke a Cloud Seeding API ([Cloud seeding - Wikipedia](https://en.wikipedia.org/wiki/Cloud_seeding)) from the REPL.
---
### Author:  [@joa-quim](https://discourse.julialang.org/u/joa-quim)
#### Post date: [July 15, 2025, 10:45pm UTC](https://discourse.julialang.org/t/building-a-julia-powered-e-ink-dashboard-a-dev-log/130709/5 "2025-07-15T22:45:15Z")
I need to create more tutorials for these, but you may find more _meteo_ functions in GMT.jl
> **[weather](https://www.generic-mapping-tools.org/GMTjl_doc/documentation/utilities/weather/index.html#weather)**
> **[ecmwf](https://www.generic-mapping-tools.org/GMTjl_doc/documentation/utilities/ecmwf/index.html#ecmwf)**
and the not yet documented other than docstrings _meteostat()_
---
### Author:  [@TheCedarPrince](https://discourse.julialang.org/u/TheCedarPrince)
#### Post date: [July 15, 2025, 11:34pm UTC](https://discourse.julialang.org/t/building-a-julia-powered-e-ink-dashboard-a-dev-log/130709/6 "2025-07-15T23:34:07Z")
Oh this is great! Not sure if it would be helpful to you, but would you want me to spin up a small repo that has the Julia flatbuffer OpenMeteo bindings now? Could maybe enrich GMT.jl’s OpenMeteo’s functionality even more?
Happy to share here – just on a sidequest for weather data. ☀
---
### Author:  [@joa-quim](https://discourse.julialang.org/u/joa-quim)
#### Post date: [July 16, 2025, 12:00am UTC](https://discourse.julialang.org/t/building-a-julia-powered-e-ink-dashboard-a-dev-log/130709/7 "2025-07-16T00:00:42Z")
Thanks a lot for the offer but honestly I don’t know the answer right now. You see, I have a strange stubbornness (for the the Julia community habits) that I don’t want, or I’m I’m very reluctant to accept, new dependencies. All the functionality I showed above was achieved without adding any new dependencies to the ones already in GMT.jl (which other than _jll_ and standard libs are very few. Two only).
---
### Author:  [@joa-quim](https://discourse.julialang.org/u/joa-quim)
#### Post date: [July 16, 2025, 12:15am UTC](https://discourse.julialang.org/t/building-a-julia-powered-e-ink-dashboard-a-dev-log/130709/8 "2025-07-16T00:15:18Z")
Could it be that those flatbuffers are the same as GDAL driver [FlatGeobuf](https://gdal.org/en/stable/drivers/vector/flatgeobuf.html)? If yes, it means that perhaps GDAL could be used to access the OpenMeteo data.
---
### Author:  [@joa-quim](https://discourse.julialang.org/u/joa-quim)
#### Post date: [July 16, 2025, 12:28am UTC](https://discourse.julialang.org/t/building-a-julia-powered-e-ink-dashboard-a-dev-log/130709/9 "2025-07-16T00:28:27Z")
Hmm, the [weather](https://www.generic-mapping-tools.org/GMTjl_doc/documentation/utilities/weather/index.html#weather) docs say that
> Plot and/or retrieve weather data obtained from the Open-Meteo API. Please consult the site for further details. You will find that there are many variables available to plot and with not so obvious names. But confess that didn’t explore much the functionality of this function after writting it (which was inspired in [WeatherReport.jl](https://github.com/vnegi10/WeatherReport.jl))
---
### Author:  [@TheCedarPrince](https://discourse.julialang.org/u/TheCedarPrince)
#### Post date: [July 18, 2025, 4:48am UTC](https://discourse.julialang.org/t/building-a-julia-powered-e-ink-dashboard-a-dev-log/130709/10 "2025-07-18T04:48:44Z")
**Log 03: July 17th, 2025 - Weather Wizardry**
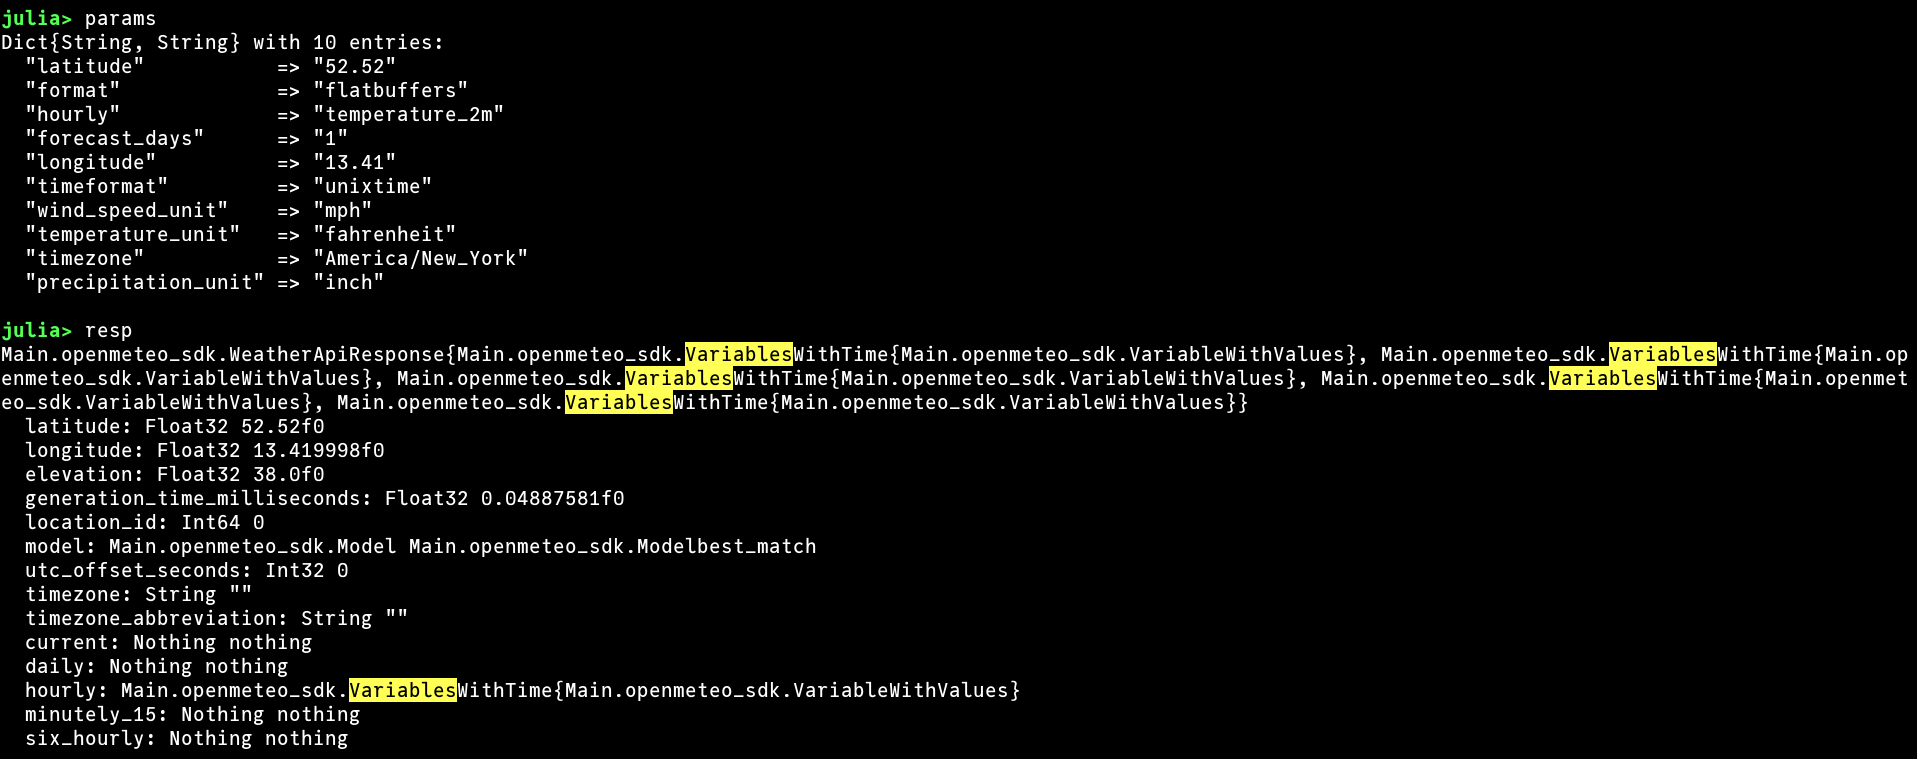
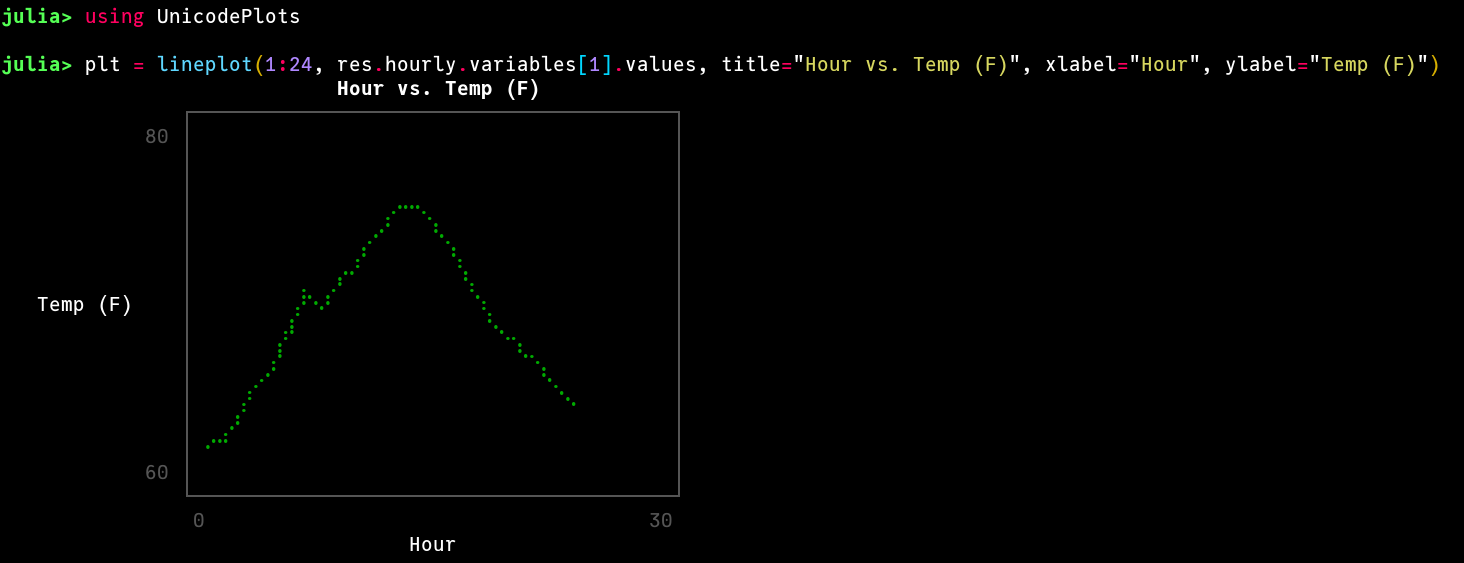
Relaxed a little this evening and tinkered some more with FlatBuffers.jl, OpenMeteo, and HTTP.jl. After a lot of experimentation and then AI-assisted refactoring, I was able to actually get the flatbuffer spec of OpenMeteo output a Julia interface and have it working to get all the weather information I want!
* * *
Here’s a small example:
And with UnicodePlots.jl gives a nice output:
* * *
I’ll bundle this prototype together into a small Julia package to work with OpenMeteo more generally. Might be useful more generally in the future, but that means: we have weather data now! ☀
---
### Author:  [@TheCedarPrince](https://discourse.julialang.org/u/TheCedarPrince)
#### Post date: [July 21, 2025, 11:59pm UTC](https://discourse.julialang.org/t/building-a-julia-powered-e-ink-dashboard-a-dev-log/130709/11 "2025-07-21T23:59:19Z")
**Log 04: July 20th, 2025 - Polar Pi 🥧**
Behold! We have [OpenMeteo.jl](https://github.com/TheCedarPrince/OpenMeteo.jl) now! It is undocumented, untested, and unregistered but it exists as a package now and fully utilizes the FlatBuffer specification from OpenMeteo! It supports all endpoints from OpenMeteo including the forecast, air quality, and additional modules here: [🌦️ Docs | Open-Meteo.com](https://open-meteo.com/en/docs)
It only has one function right now but here is an example on how to use it:
```julia
using OpenMeteo
url = "https://api.open-meteo.com/v1/forecast"
params = Dict(
"latitude" => "42.3751",
"longitude" => "-71.1056",
"daily" => [
"temperature_2m_max",
"temperature_2m_min",
"sunset",
"sunrise",
"wind_speed_10m_max",
"wind_gusts_10m_max",
"wind_speed_10m_min",
"wind_gusts_10m_min"
],
"hourly" => [
"temperature_2m",
"uv_index",
"precipitation_probability",
"precipitation",
"relative_humidity_2m",
"wind_speed_10m",
"wind_direction_10m"
],
"timezone" => "America/New_York",
"forecast_days" => "1",
"timeformat" => "unixtime",
"wind_speed_unit" => "mph",
"temperature_unit" => "fahrenheit",
"precipitation_unit" => "inch"
)
method = "GET"
verify = true
resp = OpenMeteo.request_weather_api(url, params = params, method = method, verify = verify)[1]
hourly_vars = Dict(params["hourly"] .=> [resp.hourly.variables[x].values for x in 1:length(params["hourly"])])
daily_vars = Dict(params["daily"] .=> [resp.daily.variables[x].values for x in 1:length(params["daily"])])
sunset = resp.daily.variables[3].values_int64
sunrise = resp.daily.variables[4].values_int64
```
Which gives an output response like:
```julia-repl
julia> resp
OpenMeteo.WeatherApiResponse{OpenMeteo.VariablesWithTime{OpenMeteo.VariableWithValues}, OpenMeteo.VariablesWithTime{OpenMeteo.VariableWithValues}, OpenMeteo.Vari
ablesWithTime{OpenMeteo.VariableWithValues}, OpenMeteo.VariablesWithTime{OpenMeteo.VariableWithValues}, OpenMeteo.VariablesWithTime{OpenMeteo.VariableWithValues}
}
latitude: Float32 42.372776f0
longitude: Float32 -71.09675f0
elevation: Float32 12.0f0
generation_time_milliseconds: Float32 0.106573105f0
location_id: Int64 0
model: OpenMeteo.Model OpenMeteo.Modelbest_match
utc_offset_seconds: Int32 -14400
timezone: String "America/New_York"
timezone_abbreviation: String "GMT-4"
current: Nothing nothing
daily: OpenMeteo.VariablesWithTime{OpenMeteo.VariableWithValues}
hourly: OpenMeteo.VariablesWithTime{OpenMeteo.VariableWithValues}
minutely_15: Nothing nothing
six_hourly: Nothing nothing
```
On this occasion, I celebrate with a gif:

So what do I do with this unstoppable power? Well, visualize it of course!
* * *
Here are some rough cut attempts at the moment:
```julia
using CairoMakie
using OpenMeteo
url = "https://api.open-meteo.com/v1/forecast"
params = Dict(
"latitude" => "42.3751",
"longitude" => "-71.1056",
"daily" => [
"temperature_2m_max",
"temperature_2m_min",
"sunset",
"sunrise",
"wind_speed_10m_max",
"wind_gusts_10m_max",
"wind_speed_10m_min",
"wind_gusts_10m_min"
],
"hourly" => [
"temperature_2m",
"uv_index",
"precipitation_probability",
"precipitation",
"relative_humidity_2m",
"wind_speed_10m",
"wind_direction_10m"
],
"timezone" => "America/New_York",
"forecast_days" => "1",
"timeformat" => "unixtime",
"wind_speed_unit" => "mph",
"temperature_unit" => "fahrenheit",
"precipitation_unit" => "inch"
)
method = "GET"
verify = true
resp = OpenMeteo.request_weather_api(url, params = params, method = method, verify = verify)[1]
hourly_vars = Dict(params["hourly"] .=> [resp.hourly.variables[x].values for x in 1:length(params["hourly"])])
daily_vars = Dict(params["daily"] .=> [resp.daily.variables[x].values for x in 1:length(params["daily"])])
sunset = resp.daily.variables[3].values_int64
sunrise = resp.daily.variables[4].values_int64
f = Figure(size = (400, 240));
ax = PolarAxis(
f[1, 1],
rminorgridvisible = false,
rminorticksvisible = false,
rgridvisible = false,
rticks = LinearTicks(2),
rticklabelsize = 10,
rticklabelsvisible = false,
rgridcolor = :blue,
rlimits = (minimum(hourly_vars["temperature_2m"]) - 5, maximum(hourly_vars["temperature_2m"]) + 5),
thetaminorticksvisible = false,
thetaticks = (collect(-3pi/2:15 * pi / 180:pi/2)[1:end-1], vcat("0", ["$x" for x in 23:-1:1])),
thetaticklabelsize = 10,
thetaminorticks = IntervalsBetween(3),
thetagridcolor = :lightgray
)
lines!(ax, collect(-3pi/2:15 * pi / 180:pi/2), vcat(reverse(hourly_vars["temperature_2m"]), hourly_vars["temperature_2m"][1]), color = :dimgray)
markers = []
for val in reverse(hourly_vars["uv_index"])
println(val)
if 0 <= val < 3
push!(markers, :circle)
elseif 3 <= val < 6
push!(markers, :utriangle)
elseif 6 <= val < 8
push!(markers, :diamond)
elseif 8 <= val < 11
push!(markers, :star4)
elseif 11 <= val
push!(markers, :xcross)
end
end
scatter!(ax, collect(-3pi/2:15 * pi / 180:pi/2)[1:end-1], reverse(hourly_vars["temperature_2m"]), color = :black, markersize = 12, marker = markers)
```
Which gives the following:
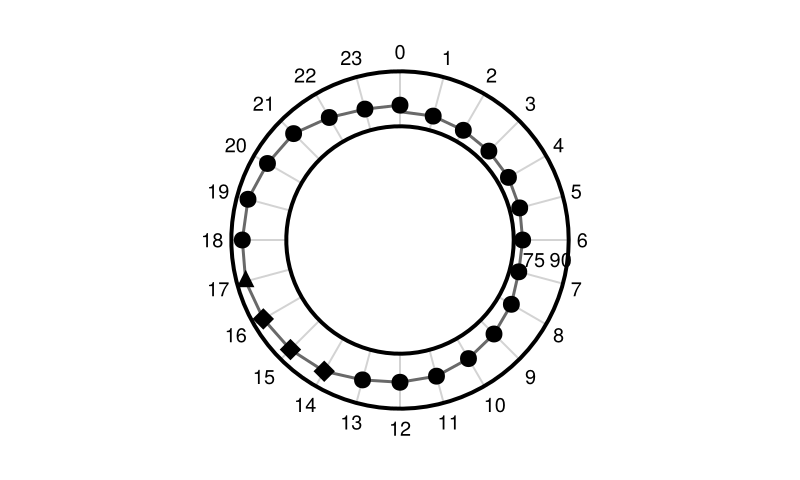
The symbols correspond to UV index (with circle being least dangerous and xcross being the most dangerous) and this represents temperature change over 24 hours. I still need a better way to display the band minimum and maximum weather temperatures. Don’t know an elegant way yet…
From there, we have windspeed and direction!
```julia
f = Figure(size = (400, 240));
ax = PolarAxis(
f[1, 1],
rminorgridvisible = false,
rminorticksvisible = false,
rgridvisible = false,
rticks = LinearTicks(2),
rticklabelsize = 10,
rticklabelsvisible = true,
rgridcolor = :blue,
rlimits = (minimum(hourly_vars["wind_speed_10m"]), maximum(hourly_vars["wind_speed_10m"]) + 2),
thetaminorticksvisible = false,
thetaticks = (collect(-3pi/2:15 * pi / 180:pi/2)[1:end-1], vcat("0", ["$x" for x in 23:-1:1])),
thetaticklabelsize = 10,
thetaminorticks = IntervalsBetween(3),
thetagridcolor = :lightgray
)
lines!(ax, collect(-3pi/2:15 * pi / 180:pi/2), vcat(reverse(hourly_vars["wind_speed_10m"]), hourly_vars["wind_speed_10m"][1]), color = :dimgray)
scatter!(ax, collect(-3pi/2:15 * pi / 180:pi/2)[1:end-1], reverse(hourly_vars["wind_speed_10m"]), color = :black, markersize = 12, marker = '↑', rotation = hourly_vars["wind_direction_10m"] .* (pi / 180))
```

It’s not quite so clean yet, but we are getting there.
* * *
Now, I need to figure out how to plot a radial bar chart with probabilities of precipitation and precipitation amount. Additionally, I have no idea how to make this into one figure that shares concentric rings. Ideally, windspeed would be inside the temperature and UV plot. Does anyone know how to do this?
At any rate, we are progressing quite well! Until the next adventurous hacking – maybe at JuliaCon with @mitiemannn? 🤔 I’ll be bringing my Pi and display with me. 😃 Happy to hack when not engaged with JuliaHealth shenanigans or AlgebraicJulia stuff too! Just grab me!
~ tcp 🌳
---
### Author:  [@mitiemannn](https://discourse.julialang.org/u/mitiemannn)
#### Post date: [July 22, 2025, 11:50am UTC](https://discourse.julialang.org/t/building-a-julia-powered-e-ink-dashboard-a-dev-log/130709/12 "2025-07-22T11:50:09Z")
I’m gonna be honest - I don’t like it. I don’t like that is not already featured at this year’s JuliaCon 😜 All the other stuff: I love it! If you promise to submit it as a talk, I’ll promise to submit “Recreational Julia, Vol. 2” as another mini next year.
---
### Author:  [@TheCedarPrince](https://discourse.julialang.org/u/TheCedarPrince)
#### Post date: [July 22, 2025, 6:51pm UTC](https://discourse.julialang.org/t/building-a-julia-powered-e-ink-dashboard-a-dev-log/130709/13 "2025-07-22T18:51:41Z")
Lemme make it through this JuliaCon and then I can have brain capacity for JuliaCon '26. 😂
---
### Author:  [@TheCedarPrince](https://discourse.julialang.org/u/TheCedarPrince)
#### Post date: [August 3, 2025, 11:57pm UTC](https://discourse.julialang.org/t/building-a-julia-powered-e-ink-dashboard-a-dev-log/130709/14 "2025-08-03T23:57:20Z")
**Log 05: August 3rd, 2025 - Seeing the Vision 🔍**
AT LAST! I posted another discussion over
in Discourse about [How To Make Concentric Polar Axes with Custom Band Size in Makie?](https://discourse.julialang.org/t/how-to-make-concentric-polar-axes-with-custom-band-size-in-makie/131137) and thanks to some pointers from @jules and tinkering by @JonasWickman, I was able to get the vision of my Polar weather plot working:
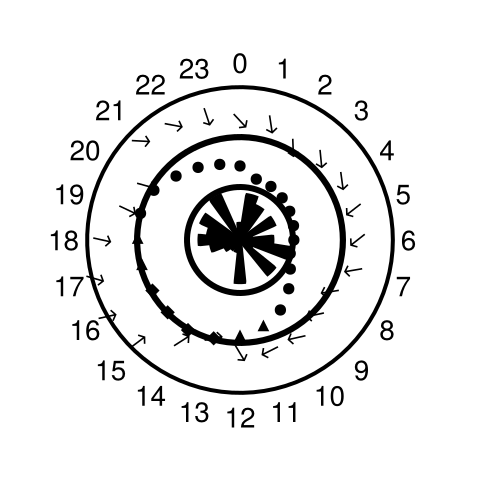
Many thanks for the support from folks on the help! Also, I had to update and figure out how to hack out the radial bar plot hack using CairoMakie.jl based on the following post: [Wind Rose 'hard' stacked barplot edges in GLMakie - #2 by ffreyer](https://discourse.julialang.org/t/wind-rose-hard-stacked-barplot-edges-in-glmakie/124277/2) and solution by @ffreyer. To create a figure like this, the code (with updates to the Makie interface) is here:
```julia
using CairoMakie
using Luxor
f = Figure(
size = (240, 240)
);
function scale_vals(data, r)
r_min = minimum(data)
r_max = maximum(data)
t_min = r[1]
t_max = r[2]
[(m - r_min)/(r_max - r_min) * (t_max - t_min) + t_min for m in data]
end
# Outside ring
ax = PolarAxis(
f[1, 1],
width = 200,
height = 240,
rminorgridvisible = false,
rminorticksvisible = false,
rgridvisible = false,
rticks = LinearTicks(2),
rticklabelsize = 10,
rticklabelsvisible = false,
rgridcolor = :blue,
rlimits = (6.66, 10),
thetaminorticksvisible = false,
thetaticks = (collect(-3pi/2:15 * pi / 180:pi/2)[1:end-1], vcat("0", ["$x" for x in 23:-1:1])),
thetaticklabelsize = 14,
thetaminorticks = IntervalsBetween(3),
thetagridcolor = :black,
thetagridvisible = false,
thetagridwidth = 1,
clip = false
)
scatter!(ax, collect(-3pi/2:15 * pi / 180:pi/2)[1:end-1], scale_vals(reverse(hourly_vars["wind_speed_10m"]), ax.rlimits.val), color = :black, markersize = 12, marker = '↑', rotation = hourly_vars["wind_direction_10m"] .* (pi / 180))
# Middle ring
ax = PolarAxis(
f[1, 1],
width=120,
height=120,
rminorgridvisible = false,
rminorticksvisible = false,
rgridvisible = false,
rticks = LinearTicks(2),
rticklabelsize = 10,
rticklabelsvisible = false,
rgridcolor = :blue,
rlimits = (3.33, 6.66),
thetaminorticksvisible = false,
thetaticks = (collect(-3pi/2:15 * pi / 180:pi/2)[1:end-1], vcat("0", ["$x" for x in 23:-1:1])),
thetaticklabelsize = 10,
thetaticklabelsvisible = false,
thetaminorticks = IntervalsBetween(3),
thetagridcolor = :black,
thetagridvisible = false,
thetagridwidth = 1,
clip = false,
)
norm_val = ax.rlimits.val[1] / minimum(hourly_vars["temperature_2m"])
scatter!(ax, collect(-3pi/2:15 * pi / 180:pi/2)[1:end-1], scale_vals(reverse(hourly_vars["temperature_2m"]), ax.rlimits.val), color = :black, markersize = 8, marker = markers)
# Inside ring
ax = PolarAxis(
f[1,1];
width=70,
height=70,
rlimits = (0, 3.33),
rminorgridvisible = false,
rminorticksvisible = false,
rgridvisible = false,
rticks = LinearTicks(2),
rticklabelsize = 10,
rticklabelsvisible = false,
rgridcolor = :blue,
thetaminorticksvisible = false,
thetaticks = (collect(-3pi/2:15 * pi / 180:pi/2)[1:end-1], vcat("0", ["$x" for x in 23:-1:1])),
thetaticklabelsvisible = false,
thetaminorticks = IntervalsBetween(3),
thetagridcolor = :black,
thetagridvisible = false,
thetagridwidth = 1,
clip = false,
);
p = barplot!(ax, collect(-3pi/2:15 * pi / 180:pi/2)[1:end-1], rand(0:.1:3.33, 24))
pp = popat!(p.plots, findfirst(x -> x isa Poly, p.plots))
polys = map(pp[1].value) do rects
map(rects) do rect
N_steps = 100
mini = minimum(rect); maxi = maximum(rect)
ps = Point2f[mini, Point2f(mini[1], maxi[2]), maxi, Point2f(maxi[1], mini[2]), mini]
ps = map(range(0, 4, length = N_steps)) do f
ps[1] * max(0, 1-f) +
ps[2] * max(0, 1 - abs(f-1)) +
ps[3] * max(0, 1 - abs(f-2)) +
ps[4] * max(0, 1 - abs(f-3)) +
ps[5] * max(0, 1 - abs(f-4))
end
Makie.Polygon(ps)
end
end
poly!(p, attributes(pp), polys[1], strokecolor = :black, strokewidth = 2, color = :black)
```
Here’s how it looks on my eink display:

* * *
With this part out of the way, I think we now dip back more into software engineering. Basically, what I need to figure out is how to best create a layout-ing engine for my eink display that:
- Keeps track of where components are in a display
- Segments out the display into a grid
- Handles components
The biggest question I have is where to put my tinkerings for components. Probably I’ll make a package like JinkiesComponents that has a bunch of extensions to load different components like for weather, todo lists, calendars, etc.
And with that! We are back to hackings!
---
### Author:  [@TheCedarPrince](https://discourse.julialang.org/u/TheCedarPrince)
#### Post date: [August 18, 2025, 3:15pm UTC](https://discourse.julialang.org/t/building-a-julia-powered-e-ink-dashboard-a-dev-log/130709/15 "2025-08-18T15:15:15Z")
**Log 06: August 18th, 2025 - Hacking. And More Hacking. 🧑💻**
As I mentioned in the last post, we are now mostly back to the world of software. At this stage, I realize the following will probably make sense to make:
- A package for OpenMeteo.jl – this is already started but hasn’t been polished yet
- A package for [timewarrior](https://timewarrior.net) – I have scraps of code for this, but nothing package worthy yet
- A package for [todo.txt](https://github.com/todotxt/todo.txt) – some small scraps here and there but nothing I am satisfied with as a package yet
- Definitely a JinkiesComponents.jl package; I’ll probably have JinkiesComponents depend entirely on extensions with some basic functionality
* * *
Otherwise, this dashboard is now rapidly becoming quite useful actually. I am in the process at my home to get this dashboard running 24/7 so I can start using it for regular check-ins. Some more things I am beginning to think about:
- How do I use DaemonMode.jl by @dmolina to trigger a script in the background of my Pi every hour? Does it work like a cron job?
- Does anybody know how to do 3D modeling on Linux? Can anyone suggest me some tools? Maybe @sjkelly ?
- What are good fonts for displaying on an eink display? Maybe @cormullion has some thoughts?
* * *
At some point, this hobby project switched from, “Oh this is just a little fun screwball code project” to “Oh, I’d quite like this up and running as soon as possible; I want it!” Pretty neat to see the feeling evolve. Finally, here is a photo of current progress:

The calendar is a bit garish so I am thinking about how to either make that more compact or… Something! Also the timewarrior plot (thanks for the help @sdanisch in [Time-Axis Linked Bar Plot with Gaps](https://discourse.julialang.org/t/time-axis-linked-bar-plot-with-gaps/131632) and inspiration James Howard) somehow lost the bottom line of the plot box. This is not a Makie.jl bug but an e-ink resolution issue… That I will fix. At some point.
---
### Author:  [@Jake](https://discourse.julialang.org/u/Jake)
#### Post date: [August 18, 2025, 6:56pm UTC](https://discourse.julialang.org/t/building-a-julia-powered-e-ink-dashboard-a-dev-log/130709/16 "2025-08-18T18:56:34Z")
> [@TheCedarPrince](#):
>
> Does anybody know how to do 3D modeling on Linux? Can anyone suggest me some tools?
I would probably start with FreeCAD.
---
### Author:  [@cormullion](https://discourse.julialang.org/u/cormullion)
#### Post date: [August 18, 2025, 7:18pm UTC](https://discourse.julialang.org/t/building-a-julia-powered-e-ink-dashboard-a-dev-log/130709/17 "2025-08-18T19:18:12Z")
I suppose a bitmap font would be good, but a normal font that might work well is Bitter, which has slab serifs that might work well on screens, and has a good range of weights you can use for information hierarchy.
> **[Bitter - Google Fonts](https://fonts.google.com/specimen/Bitter)**
>
> People read and interact with text on screens more and more each day. What happens on screen ends up being more important than what comes out of the printer. Wi