A rectilinear grid with vertices at sorted coordinates x, y, z, …, manifold M (default to 𝔼) and CRS type C (default to Cartesian).
As mentioned in docs that RectilinearGrid{M,C}(x, y, z, ...) takes vertices position as input so we should use updated grid having interface( vertices) positions instead of cell center position.
using Meshes, CoordRefSystems ,GLMakie
r = Float32[1.6, 1.754088, 1.9230156, 2.1082115, 2.311243, 2.5338273, 2.7778475, 3.0453684, 3.3386526, 3.6601818, 4.012676, 4.3991165, 4.8227735, 5.287231, 5.7964177, 6.354642, 6.9666257, 7.637547, 8.373081]
θ = Float32[0.0, 0.09817477, 0.19634955, 0.2945243, 0.3926991]
ϕ = Float32[0.0, 0.3926991, 0.7853982, 1.1780972, 1.5707964, 1.9634954, 2.3561945, 2.7488935, 3.1415927, 3.5342917, 3.9269907, 4.3196898, 4.712389, 5.105088, 5.497787, 5.8904862, 6.2831855]
g = RectilinearGrid{𝔼,typeof(Spherical(0,0,0))}(r, θ, ϕ)
nrho = Float32[-1.1714578, -1.2472875, -1.322693, -1.3975087, -1.4716849, -1.5451759, -1.6179619, -1.6899028, -1.7608551, -1.8307877, -1.8996242, -1.9671878, -2.0332665, -2.0978618, -2.1609561, -2.2226608, -2.2823706, -2.340588, -1.1715631, -1.2474244, -1.3228848, -1.3977215, -1.4718758, -1.5453428, -1.6180837, -1.6900156, -1.7609937, -1.8309395, -1.8997688, -1.9672955, -2.0334167, -2.0981252, -2.1613128, -2.2229588, -2.2830713, -2.3416867, -1.1722019, -1.2480953, -1.3235761, -1.3984082, -1.4726045, -1.5460472, -1.6186919, -1.6906736, -1.7616904, -1.8316724, -1.9005439, -1.96812, -2.0342703, -2.0989943, -2.162389, -2.2243102, -2.28464, -2.3433204, -1.1707933, -1.24678, -1.3222178, -1.3970926, -1.4712998, -1.5451258, -1.6184716, -1.6906587, -1.7618002, -1.8318613, -1.9007814, -1.9684634, -2.0347664, -2.099652, -2.1631055, -2.225059, -2.2854295, -2.3441627, -1.1714332, -1.2472333, -1.3226207, -1.3974389, -1.4716618, -1.5452027, -1.6180289, -1.6900054, -1.7610146, -1.8309885, -1.8998591, -1.9674323, -2.0335329, -2.0981572, -2.1612647, -2.222958, -2.2826889, -2.34112, -1.1715672, -1.2473985, -1.3228098, -1.397611, -1.4718192, -1.5453582, -1.6181394, -1.6901109, -1.7611424, -1.8311764, -1.900097, -1.9677126, -2.0339403, -2.0986838, -2.161936, -2.2236636, -2.283796, -2.3423233, -1.1722225, -1.2480645, -1.3234805, -1.3982757, -1.4725114, -1.5460465, -1.6187577, -1.6907791, -1.7618713, -1.8319815, -1.9009889, -1.9686785, -2.034956, -2.0998902, -2.1634405, -2.22551, -2.2860036, -2.3447285, -1.1708302, -1.2467304, -1.3220963, -1.3969547, -1.47121, -1.5451317, -1.6185337, -1.6907562, -1.7619969, -1.8322183, -1.9013324, -1.9692063, -2.0356987, -2.1007752, -2.1644397, -2.226599, -2.2871647, -2.346057, -1.1713725, -1.2471281, -1.322535, -1.3973972, -1.4716582, -1.5452492, -1.6181232, -1.6901381, -1.7611569, -1.8311728, -1.9000852, -1.9676795, -2.033817, -2.0984473, -2.1615403, -2.2231243, -2.2829778, -2.341664, -1.1715162, -1.2472692, -1.3226597, -1.397507, -1.4717674, -1.5453339, -1.6182044, -1.6902425, -1.761328, -1.8314297, -1.9004263, -1.9681461, -2.0344415, -2.099223, -2.1624768, -2.2242236, -2.2843952, -2.3428557, -1.1721138, -1.247881, -1.3232508, -1.3981302, -1.4723841, -1.5459003, -1.6188234, -1.6909295, -1.7621124, -1.8323233, -1.9014419, -1.969273, -2.0357246, -2.10076, -2.1643655, -2.2265103, -2.2870452, -2.3457806, -1.1706777, -1.2464945, -1.3218893, -1.3967377, -1.4713129, -1.5455053, -1.6186503, -1.690908, -1.7622575, -1.8326273, -1.9019182, -1.9699992, -2.036704, -2.1019228, -2.1656358, -2.227845, -2.2884812, -2.3474674, -1.1712964, -1.2470696, -1.3224833, -1.3973699, -1.4716754, -1.5453179, -1.6182187, -1.6902452, -1.7612915, -1.8313323, -1.9002707, -1.9678837, -2.0340288, -2.098651, -2.1617568, -2.2233016, -2.283355, -2.3422601, -1.171428, -1.247176, -1.3225602, -1.3974378, -1.4717767, -1.5454111, -1.6183242, -1.6903998, -1.7615452, -1.8316926, -1.9007342, -1.9685209, -2.0348656, -2.0996838, -2.1629794, -2.2246985, -2.2848144, -2.3432848, -1.1719552, -1.2477223, -1.3231068, -1.3980321, -1.4723746, -1.5459977, -1.6190054, -1.6911906, -1.7624669, -1.8327609, -1.9019221, -1.9698609, -2.0364966, -2.1016834, -2.1653824, -2.2275486, -2.2880986, -2.3467503, -1.170473, -1.2463174, -1.3217636, -1.396705, -1.4713668, -1.5456196, -1.618855, -1.6912266, -1.7627228, -1.8332341, -1.9026556, -1.9708892, -2.0378082, -2.1032093, -2.1670063, -2.229261, -2.2899466, -2.3489435, -1.1712495, -1.2470198, -1.3224418, -1.3973545, -1.4716977, -1.5453709, -1.618294, -1.6903255, -1.761386, -1.8314332, -1.9003791, -1.9680244, -2.0341802, -2.0987864, -2.1618829, -2.2234154, -2.283387, -2.342329, -1.1713567, -1.2470824, -1.3224752, -1.3974079, -1.4717981, -1.5454748, -1.6184305, -1.6905531, -1.7617373, -1.8319006, -1.900974, -1.9688097, -2.0351815, -2.0999887, -2.163226, -2.224933, -2.2850358, -2.3434215, -1.1717982, -1.2475687, -1.3229909, -1.3979868, -1.4724063, -1.5460963, -1.6191721, -1.6914418, -1.7628083, -1.8331375, -1.9023367, -1.9703417, -2.037063, -2.1023169, -2.165974, -2.2280319, -2.288486, -2.3470838, -1.1702623, -1.2461625, -1.3216865, -1.3967228, -1.471471, -1.5457569, -1.6190764, -1.6915958, -1.7632354, -1.8338602, -1.9033525, -1.9716576, -2.0386617, -2.104152, -2.1680074, -2.230201, -2.2907395, -2.3495073, -1.1712168, -1.2469913, -1.3224211, -1.3973521, -1.4717213, -1.5454121, -1.6183358, -1.6903738, -1.7614404, -1.8314825, -1.9004135, -1.9680505, -2.034192, -2.098781, -2.1617208, -2.223068, -2.2829642, -2.3418322, -1.1712978, -1.2470185, -1.3224299, -1.3974009, -1.4718289, -1.5455434, -1.6185313, -1.6906809, -1.7618892, -1.8320543, -1.9010904, -1.9688777, -2.0352533, -2.1000698, -2.1632838, -2.2248635, -2.2848172, -2.3431761, -1.1716729, -1.2474608, -1.3229251, -1.3979753, -1.4724486, -1.5461868, -1.6193119, -1.6916518, -1.7630757, -1.8334128, -1.902577, -1.970539, -2.037209, -2.1023827, -2.165893, -2.2277503, -2.288002, -2.346411, -1.1701043, -1.2460554, -1.3216392, -1.3967414, -1.4715571, -1.5459014, -1.6192905, -1.6919075, -1.7636578, -1.8343502, -1.9038225, -1.9720534, -2.0389845, -2.1044297, -2.1681921, -2.230165, -2.2904603, -2.348938, -1.1712067, -1.2469907, -1.3224255, -1.3973589, -1.4717386, -1.5454406, -1.6183584, -1.6903836, -1.7614319, -1.8314484, -1.9003502, -1.9679456, -2.0339952, -2.098449, -2.1613483, -2.222673, -2.282415, -2.341107, -1.1712832, -1.247015, -1.3224342, -1.3974074, -1.4718555, -1.545608, -1.618604, -1.6907461, -1.7619324, -1.8320533, -1.9010361, -1.9687802, -2.0350673, -2.0997937, -2.1629279, -2.2244356, -2.2843392, -2.342606, -1.1716295, -1.2474314, -1.322914, -1.3979841, -1.4724854, -1.5462555, -1.619411, -1.691756, -1.7631414, -1.8334186, -1.9024847, -1.9702979, -2.0368125, -2.1018226, -2.1651485, -2.2268035, -2.2868886, -2.3451965, -1.1700193, -1.2459902, -1.3216106, -1.396746, -1.4715979, -1.5460203, -1.6194762, -1.6921059, -1.7638124, -1.8344392, -1.9038072, -1.9718615, -2.038606, -2.1038606, -2.1673987, -2.229109, -2.2890897, -2.3472753, -1.171214, -1.2470151, -1.322455, -1.3973781, -1.4717511, -1.5454518, -1.6183547, -1.6903516, -1.7613516, -1.8313264, -1.9001545, -1.9676168, -2.033644, -2.0980816, -2.1609068, -2.2221217, -2.2817612, -2.3402507, -1.1713121, -1.2470741, -1.3224927, -1.3974333, -1.4718647, -1.5456284, -1.618638, -1.6907487, -1.7618644, -1.831904, -1.9008263, -1.9685011, -2.0346956, -2.0993178, -2.162315, -2.223699, -2.2835095, -2.3418727, -1.1716896, -1.2475096, -1.3229792, -1.3980213, -1.4725155, -1.5463068, -1.6194551, -1.6917284, -1.7630028, -1.8331784, -1.9021211, -1.9697701, -2.0360785, -2.1008866, -2.164051, -2.2255836, -2.2854307, -2.343553, -1.1700661, -1.2460214, -1.3216226, -1.3967317, -1.4715966, -1.546105, -1.6195781, -1.6921191, -1.7636821, -1.8341703, -1.9033905, -1.9712689, -2.037776, -2.1027348, -2.1659737, -2.2274642, -2.2873385, -2.345445, -1.1712376, -1.2470596, -1.3225116, -1.3974212, -1.4717765, -1.5454417, -1.6183169, -1.6902676, -1.761196, -1.8310864, -1.8998635, -1.9673266, -2.0332873, -2.0976608, -2.1604266, -2.221632, -2.281129, -2.3395116, -1.1713494, -1.2471553, -1.3226004, -1.3975104, -1.4719332, -1.545705, -1.6186262, -1.6906679, -1.7617124, -1.8316602, -1.9004672, -1.9680189, -2.0341132, -2.0986195, -2.161521, -2.222838, -2.28263, -2.3410125, -1.1718057, -1.2476555, -1.3231416, -1.3981243, -1.4726695, -1.5465125, -1.6194572, -1.6916105, -1.7627293, -1.8327552, -1.9015995, -1.969093, -2.0351336, -2.0996833, -2.1626737, -2.2240963, -2.283914, -2.3421388, -1.1702412, -1.2461984, -1.3217359, -1.3968983, -1.4715393, -1.5458597, -1.6196109, -1.6920276, -1.7633266, -1.8335494, -1.9025898, -1.9702957, -2.0365276, -2.1011338, -2.1640513, -2.2253191, -2.2850642, -2.3432255, -1.1712704, -1.2471216, -1.3225908, -1.3974812, -1.471788, -1.5454144, -1.6182436, -1.690148, -1.7610526, -1.8308958, -1.8996017, -1.9670266, -2.0329459, -2.0972924, -2.160055, -2.2213798, -2.2807343, -2.3390071, -1.1714007, -1.2472526, -1.3227327, -1.39764, -1.4719728, -1.5456535, -1.6185395, -1.6905282, -1.7614964, -1.8313482, -1.9000701, -1.967513, -2.033485, -2.09789, -2.1607661, -2.2221284, -2.2819095, -2.3403077, -1.1719588, -1.2478677, -1.323391, -1.3983221, -1.4727309, -1.5464462, -1.6193123, -1.6914237, -1.7624239, -1.832279, -1.9009655, -1.9683717, -2.0343297, -2.0987175, -2.1615248, -2.222835, -2.2826343, -2.3408515, -1.1704872, -1.2465069, -1.3220359, -1.3970678, -1.4715118, -1.5456802, -1.6193787, -1.6917518, -1.7628987, -1.8328553, -1.9016117, -1.9690762, -2.035041, -2.0993927, -2.1621788, -2.2234564, -2.2832682, -2.3415117, -1.1713542, -1.2472317, -1.3226991, -1.3975562, -1.4718074, -1.5453697, -1.618161, -1.6900482, -1.7609155, -1.8307072, -1.8993771, -1.9667716, -2.032687, -2.0970871, -2.1599295, -2.2212698, -2.2805789, -2.3387754, -1.171467, -1.2473778, -1.3228924, -1.3977795, -1.4720377, -1.5456228, -1.6184093, -1.6903496, -1.7612733, -1.8310659, -1.8996985, -1.967043, -2.0329237, -2.0973196, -2.1602917, -2.221718, -2.2814364, -2.339742, -1.172057, -1.2480454, -1.3236175, -1.3985243, -1.4728247, -1.5463786, -1.6190958, -1.6911228, -1.7620895, -1.831865, -1.9004208, -1.967695, -2.0335414, -2.0978248, -2.1605718, -2.221938, -2.2818248, -2.3401153, -1.1706101, -1.2467253, -1.3223014, -1.3972934, -1.4715707, -1.5455252, -1.6190475, -1.6913154, -1.7624145, -1.8322568, -1.9007808, -1.9679968, -2.0338073, -2.0980678, -2.160801, -2.2220972, -2.281931, -2.3402205, -1.1713895, -1.2472965, -1.3227694, -1.3976042, -1.4718177, -1.5453254, -1.6180742, -1.689949, -1.7608026, -1.8305694, -1.8992268, -1.966621, -2.0325768, -2.0970194, -2.1599023, -2.221379, -2.2808535, -2.3387904, -1.1714652, -1.2474006, -1.322945, -1.3978573, -1.4720953, -1.5455991, -1.6182958, -1.6901762, -1.7610806, -1.8308351, -1.8994123, -1.9667046, -2.0325978, -2.097011, -2.1599486, -2.2212887, -2.28103, -2.3395357, -1.172049, -1.248055, -1.3236717, -1.3986362, -1.4729311, -1.5463749, -1.6189392, -1.690868, -1.7618055, -1.8315523, -1.9000278, -1.9672009, -2.0329633, -2.0972292, -2.1600206, -2.2214653, -2.2814193, -2.3396904, -1.1705943, -1.246728, -1.3223544, -1.3974032, -1.4716873, -1.5455356, -1.6188529, -1.6909372, -1.7619472, -1.831748, -1.9001667, -1.9672062, -2.0329084, -2.097176, -2.1599388, -2.2212725, -2.2812123, -2.3396919, -1.1714168, -1.2473443, -1.3228188, -1.3976309, -1.4718133, -1.5452825, -1.617997, -1.6898699, -1.7607285, -1.8304956, -1.8991537, -1.9665608, -2.0325449, -2.0970256, -2.16004, -2.2215576, -2.2810261, -2.3389392, -1.1714647, -1.2474049, -1.3229626, -1.3978907, -1.4721161, -1.5455586, -1.6181936, -1.6900419, -1.7609347, -1.8306805, -1.8992355, -1.9665381, -2.032444, -2.0968852, -2.1598196, -2.2211828, -2.2810616, -2.3396096, -1.1720364, -1.2480215, -1.3236465, -1.3986496, -1.4729737, -1.5463691, -1.6188381, -1.6906878, -1.7615918, -1.8313243, -1.8997849, -1.9669405, -2.0327318, -2.0970693, -2.1599529, -2.2214952, -2.2815092, -2.3397973, -1.1705832, -1.2466578, -1.3222902, -1.3973812, -1.4717349, -1.5455809, -1.6187732, -1.6906799, -1.7615747, -1.8313744, -1.8998333, -1.9668872, -2.0326283, -2.0970182, -2.15993, -2.2213345, -2.2813213, -2.339894, -1.1714361, -1.2473648, -1.322836, -1.3976352, -1.4717904, -1.5452337, -1.6179446, -1.6898237, -1.7606876, -1.8304769, -1.8991574, -1.9665924, -2.0326083, -2.097148, -2.1601846, -2.2217813, -2.2813568, -2.3392324, -1.1714803, -1.2474064, -1.322968, -1.397886, -1.4720948, -1.5455096, -1.6181084, -1.6899608, -1.7608559, -1.8306162, -1.8992031, -1.9665223, -2.0324507, -2.0969265, -2.1599348, -2.2213888, -2.2813435, -2.3399963, -1.1720558, -1.2479941, -1.3236151, -1.3986285, -1.4729378, -1.5463156, -1.6187665, -1.690596, -1.7614939, -1.8312422, -1.8997422, -1.9669706, -2.0328634, -2.0973196, -2.160286, -2.2219024, -2.2819889, -2.3402727, -1.170626, -1.2466056, -1.322221, -1.3973273, -1.4716916, -1.5455489, -1.6187205, -1.6905904, -1.7614875, -1.8313013, -1.8998063, -1.9669751, -2.032865, -2.0973985, -2.1604307, -2.221895, -2.2818902, -2.3404682, -1.1714512, -1.2473603, -1.3228163, -1.397612, -1.4717579, -1.545202, -1.6179209, -1.6898081, -1.7606925, -1.8305163, -1.8992364, -1.9667069, -2.0327647, -2.0973525, -2.160425, -2.2220676, -2.2816856, -2.339626, -1.1715024, -1.2474167, -1.3229536, -1.3978528, -1.4720308, -1.5454144, -1.618059, -1.689933, -1.7608446, -1.8306496, -1.8992846, -1.966661, -2.0326393, -2.0971677, -2.1602752, -2.2217786, -2.2817726, -2.340525, -1.1720837, -1.2480142, -1.3235903, -1.3986098, -1.4728223, -1.5460845, -1.6186955, -1.69057, -1.7614976, -1.8313075, -1.8999121, -1.9672372, -2.0332026, -2.0977442, -2.1608064, -2.222495, -2.282689, -2.3410642, -1.1706697, -1.2466122, -1.3222327, -1.3972222, -1.4717526, -1.5457723, -1.6186355, -1.6905714, -1.7615687, -1.8314381, -1.9000344, -1.9673511, -2.0333695, -2.0979888, -2.161138, -2.2227173, -2.2827256, -2.341316, -1.171461, -1.2473378, -1.3227594, -1.3975636, -1.4717249, -1.5451844, -1.6179233, -1.6898332, -1.7607514, -1.8306224, -1.8993906, -1.9669138, -2.0330074, -2.0975966, -2.1606889, -2.2223687, -2.2820373, -2.340139, -1.1715385, -1.2474291, -1.322928, -1.3977969, -1.4719634, -1.5453845, -1.6180547, -1.6899531, -1.760899, -1.8307521, -1.899473, -1.966923, -2.03297, -2.0976017, -2.1607597, -2.222347, -2.2823882, -2.34111, -1.1721438, -1.2480623, -1.3236095, -1.3985233, -1.4727408, -1.5461158, -1.618673, -1.6906034, -1.7615703, -1.8314447, -1.9001621, -1.9676118, -2.033679, -2.098311, -2.1615226, -2.223324, -2.2836006, -2.3421106, -1.1707135, -1.2467169, -1.3222448, -1.3972205, -1.4714655, -1.545257, -1.6185153, -1.6905999, -1.7616746, -1.8316141, -1.9003452, -1.9678401, -2.0339954, -2.0987306, -2.1620033, -2.2237644, -2.283944, -2.3425324]
@show size(nrho)
@show nelements(g)
@show nvertices(g)
viz(g, color=nrho)
this gives
julia> @show size(nrho)
size(nrho) = (1152,)
(1152,)
julia> @show nelements(g)
nelements(g) = 1152
1152
julia> @show nvertices(g)
nvertices(g) = 1615
1615
Thus i should not look vertex color mapping as this grid has same number(1152) of nelements as size(nrho).
Now the problem is only of getting smooth plot( interpolation) in element coloring. Can color mapped to cell body/center be interpolated(smoothened) ?
opened 06:38PM - 15 Jul 25 UTC
enhancement
### Feature description
1. Can we visualize a single Hexahedron with colors on… vertices and get the volume within with interpolated colors? Or do we need to do it at a faces (quadrangles) level?
2. I want the feature of color mapping of vertices and interpolating these values in cell of 3D Rectilinear grid mesh volume plot.
For more detail please look at this link https://discourse.julialang.org/t/3d-volume-plot-for-spherical-coordinate-grid-points/129668/29
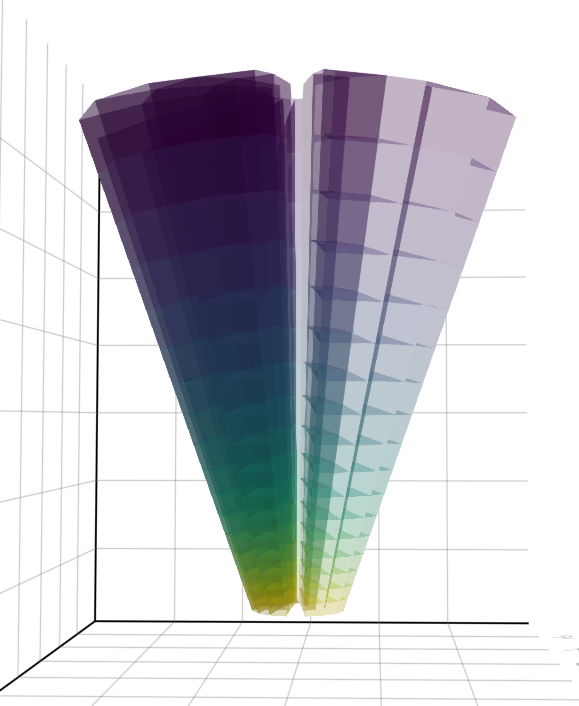
For example this code below creates a volume plot with discrete color for every cell as color is mapped to nelements .
I want to map color to nvertices of cell and interpolate these colors in cell body.
```
using Meshes, CoordRefSystems ,GLMakie

r =  Float32[1.6, 1.754088, 1.9230156, 2.1082115, 2.311243, 2.5338273, 2.7778475, 3.0453684, 3.3386526, 3.6601818, 4.012676, 4.3991165, 4.8227735, 5.287231, 5.7964177, 6.354642, 6.9666257, 7.637547, 8.373081]
θ =  Float32[0.0, 0.09817477, 0.19634955, 0.2945243, 0.3926991]
ϕ =  Float32[0.0, 0.3926991, 0.7853982, 1.1780972, 1.5707964, 1.9634954, 2.3561945, 2.7488935, 3.1415927, 3.5342917, 3.9269907, 4.3196898, 4.712389, 5.105088, 5.497787, 5.8904862, 6.2831855]

g = RectilinearGrid{𝔼,typeof(Spherical(0,0,0))}(r, θ, ϕ)
nrho = rand(1152)
viz(g, color=nrho)
```
@ffreyer Please can you provide a temporary solution for it if it may take time to implement in Makie.jl
### it looks like this
<img width="786" height="819" alt="Image" src="https://github.com/user-attachments/assets/50cb1b8c-a7ed-4814-809d-1699b967afee" />
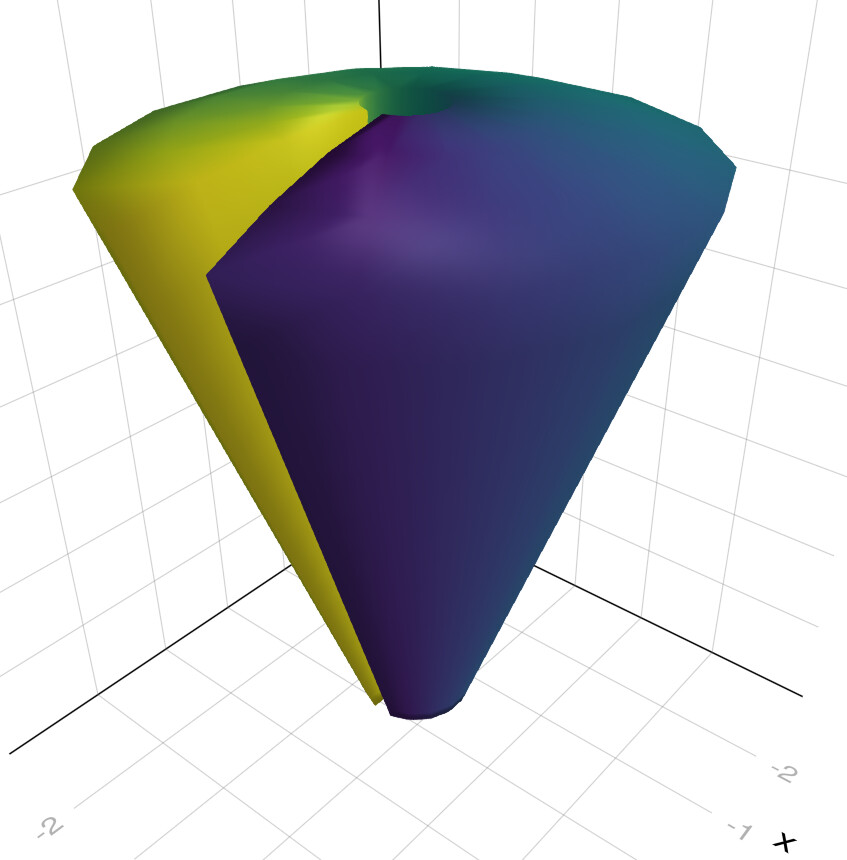
### But i need smooth plot as below.
<img width="704" height="724" alt="Image" src="https://github.com/user-attachments/assets/8b4b0ae3-f587-4d0a-8d59-896bfedf00e5" />